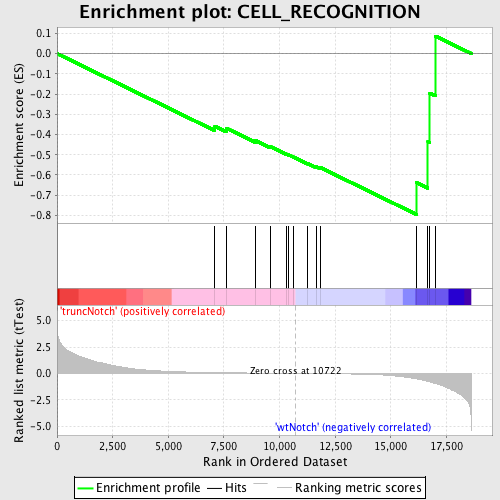
Profile of the Running ES Score & Positions of GeneSet Members on the Rank Ordered List
| Dataset | Set_03_truncNotch_versus_wtNotch.phenotype_truncNotch_versus_wtNotch.cls #truncNotch_versus_wtNotch |
| Phenotype | phenotype_truncNotch_versus_wtNotch.cls#truncNotch_versus_wtNotch |
| Upregulated in class | wtNotch |
| GeneSet | CELL_RECOGNITION |
| Enrichment Score (ES) | -0.7952635 |
| Normalized Enrichment Score (NES) | -1.6248074 |
| Nominal p-value | 0.008888889 |
| FDR q-value | 0.27610043 |
| FWER p-Value | 0.953 |
| PROBE | DESCRIPTION (from dataset) | GENE SYMBOL | GENE_TITLE | RANK IN GENE LIST | RANK METRIC SCORE | RUNNING ES | CORE ENRICHMENT | |
|---|---|---|---|---|---|---|---|---|
| 1 | COLEC12 | 2690717 4590086 | 7089 | 0.074 | -0.3587 | No | ||
| 2 | VCAN | 3290017 5910053 6940014 | 7616 | 0.059 | -0.3692 | No | ||
| 3 | PCDH12 | 5340044 | 8913 | 0.030 | -0.4297 | No | ||
| 4 | CLEC7A | 1990121 3450736 3800064 4610035 | 9571 | 0.019 | -0.4592 | No | ||
| 5 | SLIT2 | 1940037 | 10298 | 0.007 | -0.4962 | No | ||
| 6 | HNT | 6450731 | 10403 | 0.005 | -0.5002 | No | ||
| 7 | CRTAM | 4480110 | 10627 | 0.002 | -0.5117 | No | ||
| 8 | CNTN4 | 1780300 5570577 6370019 | 11264 | -0.009 | -0.5432 | No | ||
| 9 | ZP2 | 1580408 | 11637 | -0.015 | -0.5585 | No | ||
| 10 | SPAM1 | 4480398 | 11826 | -0.019 | -0.5628 | No | ||
| 11 | AMIGO1 | 6180215 | 16152 | -0.518 | -0.6380 | Yes | ||
| 12 | CDK5R1 | 3870161 | 16667 | -0.758 | -0.4353 | Yes | ||
| 13 | CADM1 | 6620128 | 16752 | -0.806 | -0.1951 | Yes | ||
| 14 | PECAM1 | 4810139 | 17008 | -0.972 | 0.0864 | Yes |

