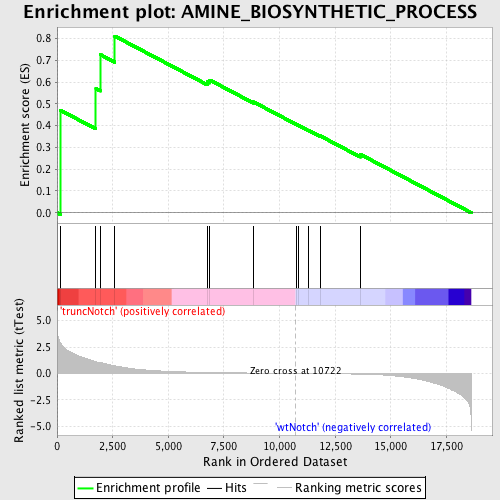
Profile of the Running ES Score & Positions of GeneSet Members on the Rank Ordered List
| Dataset | Set_03_truncNotch_versus_wtNotch.phenotype_truncNotch_versus_wtNotch.cls #truncNotch_versus_wtNotch |
| Phenotype | phenotype_truncNotch_versus_wtNotch.cls#truncNotch_versus_wtNotch |
| Upregulated in class | truncNotch |
| GeneSet | AMINE_BIOSYNTHETIC_PROCESS |
| Enrichment Score (ES) | 0.81057996 |
| Normalized Enrichment Score (NES) | 1.5085005 |
| Nominal p-value | 0.010869565 |
| FDR q-value | 0.5832652 |
| FWER p-Value | 1.0 |
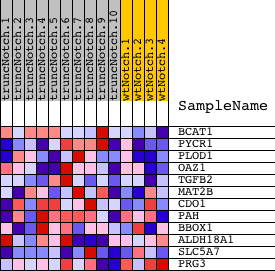
| PROBE | DESCRIPTION (from dataset) | GENE SYMBOL | GENE_TITLE | RANK IN GENE LIST | RANK METRIC SCORE | RUNNING ES | CORE ENRICHMENT | |
|---|---|---|---|---|---|---|---|---|
| 1 | BCAT1 | 3290128 4050408 | 146 | 2.890 | 0.4705 | Yes | ||
| 2 | PYCR1 | 6180670 | 1745 | 1.114 | 0.5689 | Yes | ||
| 3 | PLOD1 | 6040427 | 1936 | 1.011 | 0.7261 | Yes | ||
| 4 | OAZ1 | 110181 | 2594 | 0.724 | 0.8106 | Yes | ||
| 5 | TGFB2 | 4920292 | 6752 | 0.085 | 0.6013 | No | ||
| 6 | MAT2B | 1690139 2510706 | 6861 | 0.081 | 0.6089 | No | ||
| 7 | CDO1 | 2480279 | 8826 | 0.032 | 0.5086 | No | ||
| 8 | PAH | 3800309 | 10759 | -0.001 | 0.4049 | No | ||
| 9 | BBOX1 | 2030538 2370452 | 10869 | -0.002 | 0.3994 | No | ||
| 10 | ALDH18A1 | 2340601 | 11293 | -0.009 | 0.3782 | No | ||
| 11 | SLC5A7 | 4760091 | 11817 | -0.019 | 0.3532 | No | ||
| 12 | PRG3 | 6220020 | 13630 | -0.073 | 0.2680 | No |