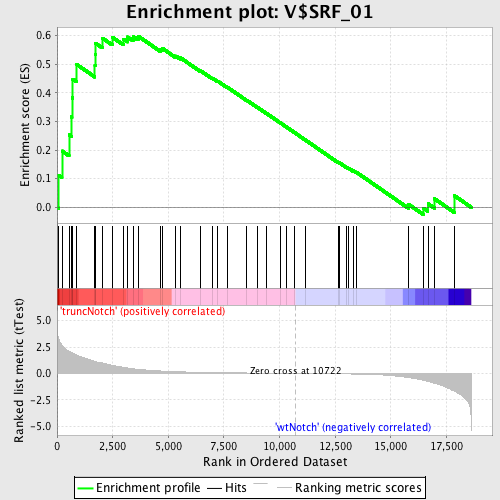
Profile of the Running ES Score & Positions of GeneSet Members on the Rank Ordered List
| Dataset | Set_03_truncNotch_versus_wtNotch.phenotype_truncNotch_versus_wtNotch.cls #truncNotch_versus_wtNotch |
| Phenotype | phenotype_truncNotch_versus_wtNotch.cls#truncNotch_versus_wtNotch |
| Upregulated in class | truncNotch |
| GeneSet | V$SRF_01 |
| Enrichment Score (ES) | 0.5979296 |
| Normalized Enrichment Score (NES) | 1.452614 |
| Nominal p-value | 0.027777778 |
| FDR q-value | 0.7093616 |
| FWER p-Value | 0.988 |
| PROBE | DESCRIPTION (from dataset) | GENE SYMBOL | GENE_TITLE | RANK IN GENE LIST | RANK METRIC SCORE | RUNNING ES | CORE ENRICHMENT | |
|---|---|---|---|---|---|---|---|---|
| 1 | FLNA | 5390193 | 62 | 3.307 | 0.1125 | Yes | ||
| 2 | ASB2 | 4760168 | 220 | 2.652 | 0.1969 | Yes | ||
| 3 | MYL6 | 60563 6100152 | 538 | 2.094 | 0.2531 | Yes | ||
| 4 | MUS81 | 6660184 | 652 | 1.968 | 0.3160 | Yes | ||
| 5 | EGR1 | 4610347 | 670 | 1.942 | 0.3831 | Yes | ||
| 6 | CNN2 | 2230433 5270446 | 706 | 1.904 | 0.4479 | Yes | ||
| 7 | TPM1 | 130673 | 883 | 1.728 | 0.4989 | Yes | ||
| 8 | PFN1 | 6130132 | 1701 | 1.144 | 0.4950 | Yes | ||
| 9 | CAP1 | 2650278 | 1715 | 1.136 | 0.5341 | Yes | ||
| 10 | WDR1 | 1090129 3990121 | 1729 | 1.129 | 0.5729 | Yes | ||
| 11 | TAZ | 7100193 | 2030 | 0.983 | 0.5912 | Yes | ||
| 12 | ANXA6 | 2190014 | 2479 | 0.771 | 0.5940 | Yes | ||
| 13 | MRVI1 | 4810338 4850601 5900441 | 2974 | 0.573 | 0.5875 | Yes | ||
| 14 | JUNB | 4230048 | 3164 | 0.504 | 0.5950 | Yes | ||
| 15 | EGR3 | 6940128 | 3418 | 0.434 | 0.5966 | Yes | ||
| 16 | FOS | 1850315 | 3645 | 0.386 | 0.5979 | Yes | ||
| 17 | PLCB3 | 4670402 | 4661 | 0.227 | 0.5512 | No | ||
| 18 | ACTG2 | 4780180 | 4745 | 0.217 | 0.5543 | No | ||
| 19 | TGFB1I1 | 2060288 6550450 | 5331 | 0.163 | 0.5285 | No | ||
| 20 | ITGB1BP2 | 6200129 | 5536 | 0.148 | 0.5227 | No | ||
| 21 | CA3 | 870687 5890390 | 6457 | 0.097 | 0.4766 | No | ||
| 22 | TNNC1 | 1990575 | 6971 | 0.077 | 0.4517 | No | ||
| 23 | CALD1 | 1770129 1940397 | 7213 | 0.070 | 0.4412 | No | ||
| 24 | IER2 | 2030008 | 7641 | 0.058 | 0.4202 | No | ||
| 25 | PHOX2B | 5270075 | 8517 | 0.038 | 0.3744 | No | ||
| 26 | FOSL1 | 430021 | 8986 | 0.029 | 0.3502 | No | ||
| 27 | EGR4 | 3120750 | 9432 | 0.021 | 0.3270 | No | ||
| 28 | DIXDC1 | 6980435 | 10047 | 0.011 | 0.2944 | No | ||
| 29 | KCNMB1 | 4760139 | 10310 | 0.006 | 0.2805 | No | ||
| 30 | MYH11 | 7100273 | 10648 | 0.001 | 0.2624 | No | ||
| 31 | IL17B | 6940711 | 11182 | -0.008 | 0.2339 | No | ||
| 32 | ACTR3 | 1400497 | 12632 | -0.037 | 0.1572 | No | ||
| 33 | THBS1 | 4560494 430288 | 12677 | -0.039 | 0.1562 | No | ||
| 34 | FOSB | 1940142 | 13018 | -0.049 | 0.1396 | No | ||
| 35 | GPR20 | 6620601 | 13118 | -0.052 | 0.1361 | No | ||
| 36 | TNMD | 3060520 | 13303 | -0.060 | 0.1283 | No | ||
| 37 | EGR2 | 3800403 | 13438 | -0.065 | 0.1234 | No | ||
| 38 | VCL | 4120487 | 15804 | -0.405 | 0.0102 | No | ||
| 39 | SLC25A4 | 2360519 | 16458 | -0.642 | -0.0025 | No | ||
| 40 | SCOC | 610048 2230053 | 16671 | -0.761 | 0.0128 | No | ||
| 41 | CFL1 | 2340735 | 16966 | -0.941 | 0.0299 | No | ||
| 42 | HOXB4 | 540131 | 17850 | -1.681 | 0.0412 | No |

