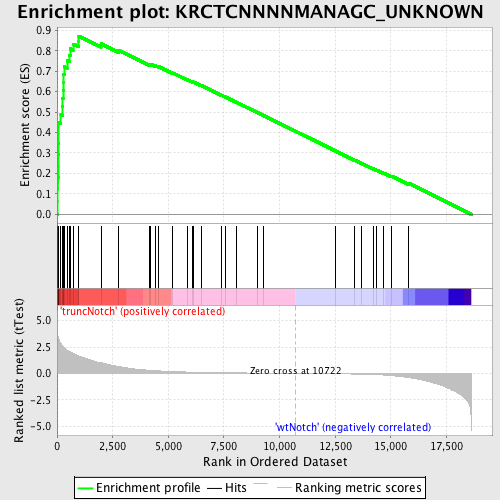
Profile of the Running ES Score & Positions of GeneSet Members on the Rank Ordered List
| Dataset | Set_03_truncNotch_versus_wtNotch.phenotype_truncNotch_versus_wtNotch.cls #truncNotch_versus_wtNotch |
| Phenotype | phenotype_truncNotch_versus_wtNotch.cls#truncNotch_versus_wtNotch |
| Upregulated in class | truncNotch |
| GeneSet | KRCTCNNNNMANAGC_UNKNOWN |
| Enrichment Score (ES) | 0.8720424 |
| Normalized Enrichment Score (NES) | 2.1299586 |
| Nominal p-value | 0.0 |
| FDR q-value | 0.0 |
| FWER p-Value | 0.0 |
| PROBE | DESCRIPTION (from dataset) | GENE SYMBOL | GENE_TITLE | RANK IN GENE LIST | RANK METRIC SCORE | RUNNING ES | CORE ENRICHMENT | |
|---|---|---|---|---|---|---|---|---|
| 1 | HIST1H3C | 730204 | 23 | 3.948 | 0.0623 | Yes | ||
| 2 | HIST1H3D | 70687 | 25 | 3.847 | 0.1242 | Yes | ||
| 3 | HIST1H3E | 840398 | 39 | 3.512 | 0.1800 | Yes | ||
| 4 | HIST2H2BE | 3360184 | 43 | 3.486 | 0.2360 | Yes | ||
| 5 | HIST1H3B | 4780092 | 44 | 3.453 | 0.2916 | Yes | ||
| 6 | HIST1H3I | 7100270 | 52 | 3.416 | 0.3462 | Yes | ||
| 7 | HIST1H3H | 2760288 | 80 | 3.215 | 0.3965 | Yes | ||
| 8 | HIST1H1A | 1450131 | 81 | 3.209 | 0.4482 | Yes | ||
| 9 | HIST1H2AB | 2680465 | 172 | 2.796 | 0.4883 | Yes | ||
| 10 | HIST1H2AE | 4920672 | 238 | 2.595 | 0.5266 | Yes | ||
| 11 | HIST1H1B | 1410592 | 250 | 2.565 | 0.5673 | Yes | ||
| 12 | HIST1H2BK | 6130433 | 271 | 2.499 | 0.6065 | Yes | ||
| 13 | HIST1H2BH | 2450039 | 279 | 2.492 | 0.6462 | Yes | ||
| 14 | HIST1H2BL | 6380070 | 286 | 2.475 | 0.6857 | Yes | ||
| 15 | HIST1H2BN | 730128 | 334 | 2.397 | 0.7218 | Yes | ||
| 16 | HIST1H2BF | 5420402 | 448 | 2.199 | 0.7511 | Yes | ||
| 17 | HIST1H2BJ | 2100551 | 547 | 2.080 | 0.7793 | Yes | ||
| 18 | HIST1H2BM | 3170168 | 585 | 2.033 | 0.8101 | Yes | ||
| 19 | HIST1H2BG | 5670632 | 717 | 1.890 | 0.8334 | Yes | ||
| 20 | HIST1H4A | 1940600 | 976 | 1.639 | 0.8459 | Yes | ||
| 21 | HIST1H2BB | 1340035 | 980 | 1.633 | 0.8720 | Yes | ||
| 22 | HIST1H2BC | 2570156 6520315 | 1973 | 1.000 | 0.8347 | No | ||
| 23 | HIST1H2BA | 2450059 | 2758 | 0.645 | 0.8029 | No | ||
| 24 | PLXNB1 | 6220273 | 4141 | 0.295 | 0.7332 | No | ||
| 25 | PHACTR3 | 3850435 5900445 | 4214 | 0.282 | 0.7339 | No | ||
| 26 | HIST1H2AI | 4540039 | 4410 | 0.258 | 0.7275 | No | ||
| 27 | HIST1H1E | 6980706 | 4541 | 0.239 | 0.7244 | No | ||
| 28 | UBE2C | 6130017 | 5204 | 0.173 | 0.6915 | No | ||
| 29 | HIST1H3G | 5690524 | 5858 | 0.127 | 0.6584 | No | ||
| 30 | HIST1H2AC | 3130292 | 6094 | 0.114 | 0.6476 | No | ||
| 31 | GBX2 | 3940736 | 6131 | 0.112 | 0.6475 | No | ||
| 32 | HIST1H1T | 130632 | 6483 | 0.096 | 0.6301 | No | ||
| 33 | HIST1H3F | 2320441 2480022 3940170 | 7386 | 0.065 | 0.5826 | No | ||
| 34 | HIST3H2BB | 70278 | 7549 | 0.061 | 0.5748 | No | ||
| 35 | SEZ6 | 3450722 | 8065 | 0.048 | 0.5479 | No | ||
| 36 | TCF21 | 2690446 | 8999 | 0.028 | 0.4981 | No | ||
| 37 | HIST1H2AH | 3710333 | 9278 | 0.024 | 0.4835 | No | ||
| 38 | HIST1H2AA | 7050100 | 12493 | -0.034 | 0.3110 | No | ||
| 39 | DSCAM | 1780050 2450731 2810438 | 13365 | -0.062 | 0.2651 | No | ||
| 40 | HIST3H2A | 1580504 | 13697 | -0.077 | 0.2485 | No | ||
| 41 | HIST1H2BE | 6550053 | 14217 | -0.109 | 0.2223 | No | ||
| 42 | HIST1H1D | 3440446 | 14376 | -0.124 | 0.2158 | No | ||
| 43 | HIST2H2AC | 2030600 | 14692 | -0.156 | 0.2014 | No | ||
| 44 | NOTCH4 | 2450040 6370707 | 15034 | -0.207 | 0.1863 | No | ||
| 45 | HIST1H1C | 3870603 | 15801 | -0.402 | 0.1516 | No |

