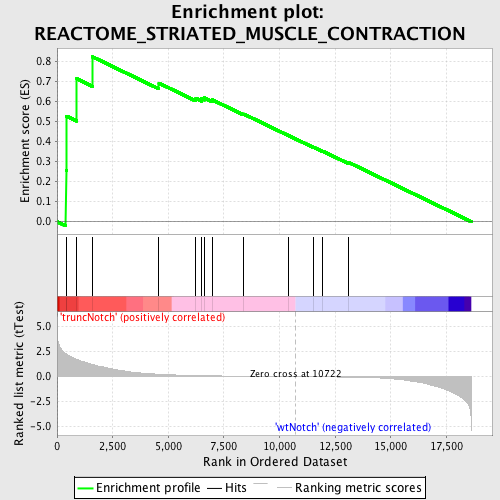
Profile of the Running ES Score & Positions of GeneSet Members on the Rank Ordered List
| Dataset | Set_03_truncNotch_versus_wtNotch.phenotype_truncNotch_versus_wtNotch.cls #truncNotch_versus_wtNotch |
| Phenotype | phenotype_truncNotch_versus_wtNotch.cls#truncNotch_versus_wtNotch |
| Upregulated in class | truncNotch |
| GeneSet | REACTOME_STRIATED_MUSCLE_CONTRACTION |
| Enrichment Score (ES) | 0.8240396 |
| Normalized Enrichment Score (NES) | 1.5978173 |
| Nominal p-value | 0.0034542314 |
| FDR q-value | 0.3702384 |
| FWER p-Value | 0.873 |
| PROBE | DESCRIPTION (from dataset) | GENE SYMBOL | GENE_TITLE | RANK IN GENE LIST | RANK METRIC SCORE | RUNNING ES | CORE ENRICHMENT | |
|---|---|---|---|---|---|---|---|---|
| 1 | ACTN2 | 4200435 | 399 | 2.276 | 0.2570 | Yes | ||
| 2 | TCAP | 4890446 | 431 | 2.223 | 0.5272 | Yes | ||
| 3 | TPM1 | 130673 | 883 | 1.728 | 0.7144 | Yes | ||
| 4 | TNNI3 | 7000093 | 1595 | 1.209 | 0.8240 | Yes | ||
| 5 | VIM | 20431 | 4577 | 0.235 | 0.6926 | No | ||
| 6 | DMD | 1740041 3990332 | 6236 | 0.107 | 0.6166 | No | ||
| 7 | TMOD1 | 3850100 | 6497 | 0.095 | 0.6143 | No | ||
| 8 | MYH6 | 2900373 | 6611 | 0.091 | 0.6193 | No | ||
| 9 | TNNC1 | 1990575 | 6971 | 0.077 | 0.6095 | No | ||
| 10 | DES | 1450341 | 8386 | 0.041 | 0.5384 | No | ||
| 11 | MYBPC2 | 1980368 | 10387 | 0.005 | 0.4316 | No | ||
| 12 | MYL3 | 6040563 | 11537 | -0.013 | 0.3714 | No | ||
| 13 | NEB | 580735 | 11932 | -0.021 | 0.3528 | No | ||
| 14 | TNNT2 | 2450364 | 13114 | -0.052 | 0.2958 | No |

