Profile of the Running ES Score & Positions of GeneSet Members on the Rank Ordered List
| Dataset | Set_03_truncNotch_versus_wtNotch.phenotype_truncNotch_versus_wtNotch.cls #truncNotch_versus_wtNotch |
| Phenotype | phenotype_truncNotch_versus_wtNotch.cls#truncNotch_versus_wtNotch |
| Upregulated in class | truncNotch |
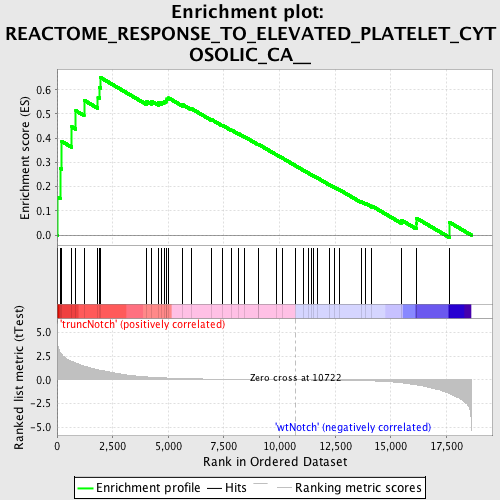
| GeneSet | REACTOME_RESPONSE_TO_ELEVATED_PLATELET_CYTOSOLIC_CA__ |
| Enrichment Score (ES) | 0.6500765 |
| Normalized Enrichment Score (NES) | 1.5870811 |
| Nominal p-value | 0.0066006603 |
| FDR q-value | 0.3532248 |
| FWER p-Value | 0.917 |
| PROBE | DESCRIPTION (from dataset) | GENE SYMBOL | GENE_TITLE | RANK IN GENE LIST | RANK METRIC SCORE | RUNNING ES | CORE ENRICHMENT | |
|---|---|---|---|---|---|---|---|---|
| 1 | ACTN4 | 3840301 4590390 7050132 | 33 | 3.637 | 0.1553 | Yes | ||
| 2 | ALDOA | 6290672 | 137 | 2.907 | 0.2753 | Yes | ||
| 3 | CLU | 5420075 | 211 | 2.667 | 0.3866 | Yes | ||
| 4 | CD63 | 6660451 | 661 | 1.956 | 0.4469 | Yes | ||
| 5 | SERPING1 | 5550440 | 842 | 1.761 | 0.5132 | Yes | ||
| 6 | TIMP1 | 1010326 | 1212 | 1.464 | 0.5566 | Yes | ||
| 7 | STX4 | 6270632 | 1836 | 1.060 | 0.5688 | Yes | ||
| 8 | PF4 | 6130332 | 1910 | 1.023 | 0.6091 | Yes | ||
| 9 | CD9 | 4730041 | 1956 | 1.005 | 0.6501 | Yes | ||
| 10 | IGF1 | 1990193 3130377 3290280 | 4031 | 0.315 | 0.5520 | No | ||
| 11 | APP | 2510053 | 4242 | 0.278 | 0.5527 | No | ||
| 12 | SELP | 6040193 | 4553 | 0.237 | 0.5462 | No | ||
| 13 | SERPINE1 | 4210403 | 4698 | 0.222 | 0.5481 | No | ||
| 14 | FGA | 4210056 5220239 | 4806 | 0.211 | 0.5514 | No | ||
| 15 | MMRN1 | 7050278 | 4895 | 0.202 | 0.5554 | No | ||
| 16 | ITGB3 | 5270463 | 4936 | 0.198 | 0.5618 | No | ||
| 17 | PPBP | 5130446 | 5011 | 0.191 | 0.5660 | No | ||
| 18 | CFD | 2320736 | 5651 | 0.140 | 0.5377 | No | ||
| 19 | KNG1 | 6400576 6770347 | 6030 | 0.118 | 0.5224 | No | ||
| 20 | F5 | 1990619 | 6922 | 0.079 | 0.4779 | No | ||
| 21 | GP9 | 1190181 | 7431 | 0.063 | 0.4533 | No | ||
| 22 | PLG | 3360270 3840100 | 7835 | 0.053 | 0.4339 | No | ||
| 23 | GP1BA | 6590372 | 8163 | 0.046 | 0.4182 | No | ||
| 24 | GP1BB | 3780075 | 8422 | 0.040 | 0.4060 | No | ||
| 25 | F8 | 2190647 2340465 | 9041 | 0.028 | 0.3740 | No | ||
| 26 | STXBP3 | 780706 | 9050 | 0.028 | 0.3747 | No | ||
| 27 | TMSB4X | 6620114 | 9838 | 0.014 | 0.3330 | No | ||
| 28 | ITGA2B | 2680538 | 10109 | 0.010 | 0.3189 | No | ||
| 29 | A2M | 6620039 | 10716 | 0.000 | 0.2863 | No | ||
| 30 | CD36 | 5890575 | 11083 | -0.006 | 0.2668 | No | ||
| 31 | GP5 | 2510088 | 11280 | -0.009 | 0.2566 | No | ||
| 32 | PROS1 | 5420465 | 11444 | -0.012 | 0.2484 | No | ||
| 33 | HRG | 2340161 | 11542 | -0.014 | 0.2437 | No | ||
| 34 | LEFTY2 | 5670364 | 11694 | -0.017 | 0.2363 | No | ||
| 35 | VWF | 4670519 | 12257 | -0.028 | 0.2073 | No | ||
| 36 | FGB | 7000010 | 12459 | -0.033 | 0.1979 | No | ||
| 37 | THBS1 | 4560494 430288 | 12677 | -0.039 | 0.1879 | No | ||
| 38 | HGF | 3360593 | 13659 | -0.075 | 0.1383 | No | ||
| 39 | SPARC | 1690086 | 13851 | -0.085 | 0.1317 | No | ||
| 40 | FGG | 4610717 | 14149 | -0.104 | 0.1202 | No | ||
| 41 | SERPINF2 | 2470390 2690292 | 15469 | -0.299 | 0.0621 | No | ||
| 42 | EGF | 5220154 | 16142 | -0.515 | 0.0482 | No | ||
| 43 | FN1 | 1170601 2970647 6220288 6940037 | 16151 | -0.517 | 0.0701 | No | ||
| 44 | LAMP2 | 1230402 1980373 | 17632 | -1.449 | 0.0530 | No |

