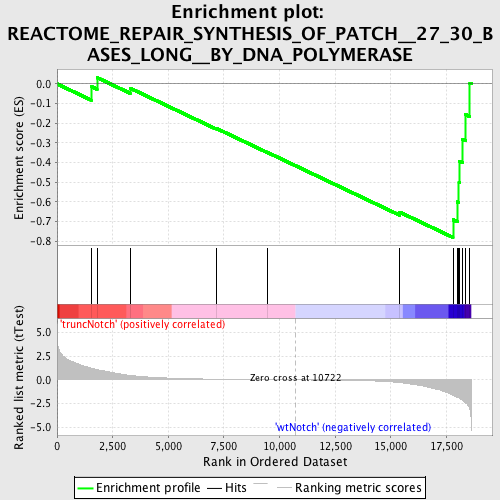
Profile of the Running ES Score & Positions of GeneSet Members on the Rank Ordered List
| Dataset | Set_03_truncNotch_versus_wtNotch.phenotype_truncNotch_versus_wtNotch.cls #truncNotch_versus_wtNotch |
| Phenotype | phenotype_truncNotch_versus_wtNotch.cls#truncNotch_versus_wtNotch |
| Upregulated in class | wtNotch |
| GeneSet | REACTOME_REPAIR_SYNTHESIS_OF_PATCH__27_30_BASES_LONG__BY_DNA_POLYMERASE |
| Enrichment Score (ES) | -0.78090847 |
| Normalized Enrichment Score (NES) | -1.5816818 |
| Nominal p-value | 0.01703163 |
| FDR q-value | 0.25886965 |
| FWER p-Value | 0.971 |
| PROBE | DESCRIPTION (from dataset) | GENE SYMBOL | GENE_TITLE | RANK IN GENE LIST | RANK METRIC SCORE | RUNNING ES | CORE ENRICHMENT | |
|---|---|---|---|---|---|---|---|---|
| 1 | RFC5 | 3800452 6020091 | 1531 | 1.251 | -0.0132 | No | ||
| 2 | POLD1 | 4830026 | 1795 | 1.079 | 0.0322 | No | ||
| 3 | POLD2 | 6400148 | 3283 | 0.469 | -0.0219 | No | ||
| 4 | RFC3 | 1980600 | 7145 | 0.072 | -0.2254 | No | ||
| 5 | POLE2 | 6110041 | 9434 | 0.021 | -0.3472 | No | ||
| 6 | RPA2 | 2760301 5420195 | 15395 | -0.283 | -0.6520 | No | ||
| 7 | RPA3 | 5700136 | 17795 | -1.631 | -0.6908 | Yes | ||
| 8 | RFC1 | 1190673 | 17986 | -1.828 | -0.6001 | Yes | ||
| 9 | POLD3 | 6400278 | 18063 | -1.899 | -0.4994 | Yes | ||
| 10 | PCNA | 940754 | 18090 | -1.941 | -0.3936 | Yes | ||
| 11 | RPA1 | 360452 | 18231 | -2.159 | -0.2819 | Yes | ||
| 12 | POLE | 6020538 | 18351 | -2.398 | -0.1559 | Yes | ||
| 13 | RFC4 | 3800082 6840142 | 18552 | -3.081 | 0.0034 | Yes |

