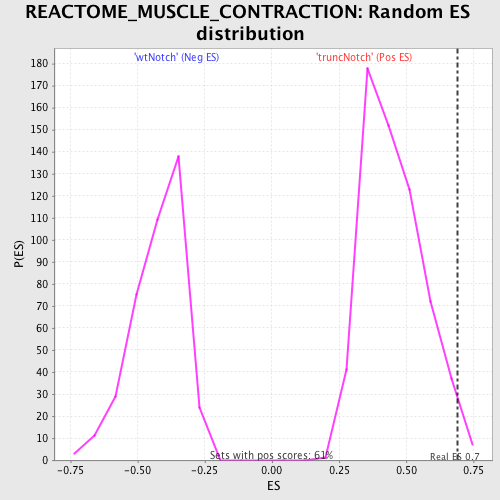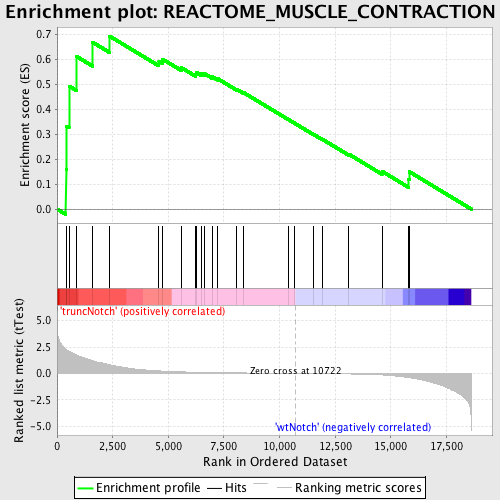
Profile of the Running ES Score & Positions of GeneSet Members on the Rank Ordered List
| Dataset | Set_03_truncNotch_versus_wtNotch.phenotype_truncNotch_versus_wtNotch.cls #truncNotch_versus_wtNotch |
| Phenotype | phenotype_truncNotch_versus_wtNotch.cls#truncNotch_versus_wtNotch |
| Upregulated in class | truncNotch |
| GeneSet | REACTOME_MUSCLE_CONTRACTION |
| Enrichment Score (ES) | 0.69267666 |
| Normalized Enrichment Score (NES) | 1.5282217 |
| Nominal p-value | 0.014729951 |
| FDR q-value | 0.38081607 |
| FWER p-Value | 0.998 |
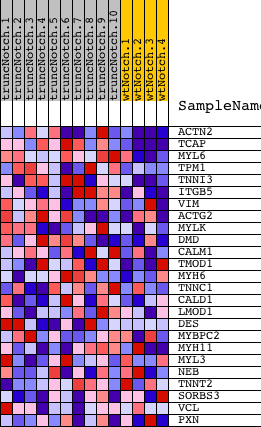
| PROBE | DESCRIPTION (from dataset) | GENE SYMBOL | GENE_TITLE | RANK IN GENE LIST | RANK METRIC SCORE | RUNNING ES | CORE ENRICHMENT | |
|---|---|---|---|---|---|---|---|---|
| 1 | ACTN2 | 4200435 | 399 | 2.276 | 0.1585 | Yes | ||
| 2 | TCAP | 4890446 | 431 | 2.223 | 0.3327 | Yes | ||
| 3 | MYL6 | 60563 6100152 | 538 | 2.094 | 0.4926 | Yes | ||
| 4 | TPM1 | 130673 | 883 | 1.728 | 0.6108 | Yes | ||
| 5 | TNNI3 | 7000093 | 1595 | 1.209 | 0.6682 | Yes | ||
| 6 | ITGB5 | 70129 | 2358 | 0.828 | 0.6927 | Yes | ||
| 7 | VIM | 20431 | 4577 | 0.235 | 0.5920 | No | ||
| 8 | ACTG2 | 4780180 | 4745 | 0.217 | 0.6002 | No | ||
| 9 | MYLK | 4010600 7000364 | 5581 | 0.144 | 0.5666 | No | ||
| 10 | DMD | 1740041 3990332 | 6236 | 0.107 | 0.5399 | No | ||
| 11 | CALM1 | 380128 | 6275 | 0.106 | 0.5463 | No | ||
| 12 | TMOD1 | 3850100 | 6497 | 0.095 | 0.5419 | No | ||
| 13 | MYH6 | 2900373 | 6611 | 0.091 | 0.5430 | No | ||
| 14 | TNNC1 | 1990575 | 6971 | 0.077 | 0.5298 | No | ||
| 15 | CALD1 | 1770129 1940397 | 7213 | 0.070 | 0.5224 | No | ||
| 16 | LMOD1 | 2120035 | 8072 | 0.047 | 0.4800 | No | ||
| 17 | DES | 1450341 | 8386 | 0.041 | 0.4664 | No | ||
| 18 | MYBPC2 | 1980368 | 10387 | 0.005 | 0.3592 | No | ||
| 19 | MYH11 | 7100273 | 10648 | 0.001 | 0.3453 | No | ||
| 20 | MYL3 | 6040563 | 11537 | -0.013 | 0.2986 | No | ||
| 21 | NEB | 580735 | 11932 | -0.021 | 0.2791 | No | ||
| 22 | TNNT2 | 2450364 | 13114 | -0.052 | 0.2197 | No | ||
| 23 | SORBS3 | 50465 | 14607 | -0.147 | 0.1511 | No | ||
| 24 | VCL | 4120487 | 15804 | -0.405 | 0.1188 | No | ||
| 25 | PXN | 3290048 6400132 | 15829 | -0.410 | 0.1499 | No |