Profile of the Running ES Score & Positions of GeneSet Members on the Rank Ordered List
| Dataset | Set_03_truncNotch_versus_wtNotch.phenotype_truncNotch_versus_wtNotch.cls #truncNotch_versus_wtNotch |
| Phenotype | phenotype_truncNotch_versus_wtNotch.cls#truncNotch_versus_wtNotch |
| Upregulated in class | truncNotch |
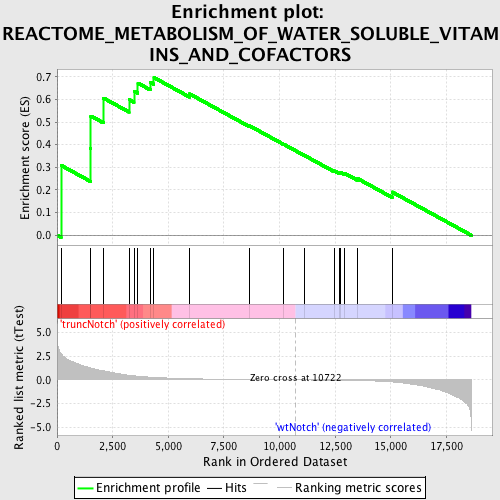
| GeneSet | REACTOME_METABOLISM_OF_WATER_SOLUBLE_VITAMINS_AND_COFACTORS |
| Enrichment Score (ES) | 0.6963369 |
| Normalized Enrichment Score (NES) | 1.451545 |
| Nominal p-value | 0.04308797 |
| FDR q-value | 0.5683361 |
| FWER p-Value | 1.0 |
| PROBE | DESCRIPTION (from dataset) | GENE SYMBOL | GENE_TITLE | RANK IN GENE LIST | RANK METRIC SCORE | RUNNING ES | CORE ENRICHMENT | |
|---|---|---|---|---|---|---|---|---|
| 1 | COASY | 6220707 | 178 | 2.771 | 0.3088 | Yes | ||
| 2 | SHMT1 | 5900132 | 1504 | 1.264 | 0.3828 | Yes | ||
| 3 | SLC2A3 | 1990377 | 1517 | 1.258 | 0.5267 | Yes | ||
| 4 | SLC19A1 | 6770139 | 2085 | 0.954 | 0.6059 | Yes | ||
| 5 | ACP5 | 2230717 | 3233 | 0.483 | 0.5997 | Yes | ||
| 6 | ENPP1 | 780609 | 3457 | 0.426 | 0.6367 | Yes | ||
| 7 | QPRT | 670270 | 3634 | 0.388 | 0.6718 | Yes | ||
| 8 | CYB5A | 5080450 | 4194 | 0.285 | 0.6745 | Yes | ||
| 9 | HAAO | 430369 450113 | 4354 | 0.265 | 0.6963 | Yes | ||
| 10 | CYB5R3 | 430097 6860400 | 5956 | 0.121 | 0.6242 | No | ||
| 11 | MTHFD1 | 5900398 6520427 | 8656 | 0.036 | 0.4831 | No | ||
| 12 | SLC25A16 | 4200341 | 10185 | 0.009 | 0.4020 | No | ||
| 13 | TDO2 | 6110048 | 11101 | -0.006 | 0.3535 | No | ||
| 14 | AFMID | 1500398 1770093 1990315 3440056 3520500 6400075 | 12464 | -0.033 | 0.2841 | No | ||
| 15 | KYNU | 1410435 | 12714 | -0.039 | 0.2752 | No | ||
| 16 | MTHFR | 7100253 | 12729 | -0.040 | 0.2790 | No | ||
| 17 | KMO | 7000132 | 12918 | -0.045 | 0.2741 | No | ||
| 18 | DHFR | 6350315 | 13517 | -0.069 | 0.2499 | No | ||
| 19 | FASN | 430717 | 15060 | -0.211 | 0.1912 | No |

