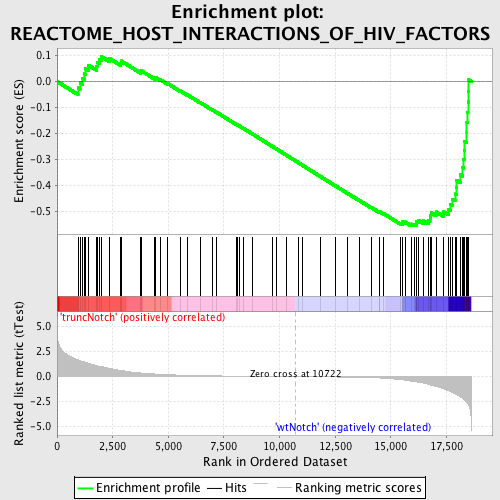
Profile of the Running ES Score & Positions of GeneSet Members on the Rank Ordered List
| Dataset | Set_03_truncNotch_versus_wtNotch.phenotype_truncNotch_versus_wtNotch.cls #truncNotch_versus_wtNotch |
| Phenotype | phenotype_truncNotch_versus_wtNotch.cls#truncNotch_versus_wtNotch |
| Upregulated in class | wtNotch |
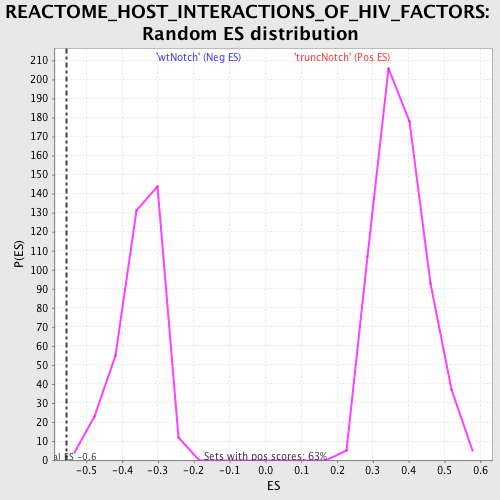
| GeneSet | REACTOME_HOST_INTERACTIONS_OF_HIV_FACTORS |
| Enrichment Score (ES) | -0.55507797 |
| Normalized Enrichment Score (NES) | -1.5821184 |
| Nominal p-value | 0.0027100272 |
| FDR q-value | 0.27093828 |
| FWER p-Value | 0.971 |
| PROBE | DESCRIPTION (from dataset) | GENE SYMBOL | GENE_TITLE | RANK IN GENE LIST | RANK METRIC SCORE | RUNNING ES | CORE ENRICHMENT | |
|---|---|---|---|---|---|---|---|---|
| 1 | PSMD2 | 4670706 5050364 | 941 | 1.679 | -0.0249 | No | ||
| 2 | NUP62 | 1240128 | 1031 | 1.591 | -0.0053 | No | ||
| 3 | PSMA1 | 380059 2760195 | 1149 | 1.500 | 0.0115 | No | ||
| 4 | AP2A2 | 130082 | 1223 | 1.459 | 0.0299 | No | ||
| 5 | PSMC1 | 6350538 | 1283 | 1.414 | 0.0485 | No | ||
| 6 | PSMD9 | 50020 5890368 | 1407 | 1.336 | 0.0624 | No | ||
| 7 | LCK | 3360142 | 1776 | 1.087 | 0.0593 | No | ||
| 8 | RANGAP1 | 2320593 6650601 | 1814 | 1.071 | 0.0737 | No | ||
| 9 | PACS1 | 4810372 | 1917 | 1.021 | 0.0839 | No | ||
| 10 | PSMA7 | 2230131 | 2006 | 0.993 | 0.0944 | No | ||
| 11 | BANF1 | 460164 2850170 6110139 | 2349 | 0.831 | 0.0888 | No | ||
| 12 | PSMB6 | 2690711 | 2861 | 0.612 | 0.0706 | No | ||
| 13 | PSMB10 | 630504 6510039 | 2884 | 0.604 | 0.0787 | No | ||
| 14 | PSMB3 | 4280594 | 3764 | 0.359 | 0.0368 | No | ||
| 15 | AP1B1 | 4290373 | 3791 | 0.354 | 0.0409 | No | ||
| 16 | FYN | 2100468 4760520 4850687 | 4389 | 0.260 | 0.0127 | No | ||
| 17 | PSMA5 | 5390537 | 4404 | 0.258 | 0.0159 | No | ||
| 18 | PPIA | 2900368 4850162 | 4634 | 0.230 | 0.0071 | No | ||
| 19 | NUP188 | 1190470 | 4961 | 0.195 | -0.0075 | No | ||
| 20 | CCNT1 | 2450563 5390184 | 5523 | 0.149 | -0.0355 | No | ||
| 21 | PSMB4 | 520402 | 5847 | 0.127 | -0.0510 | No | ||
| 22 | HCK | 4230592 | 6440 | 0.098 | -0.0814 | No | ||
| 23 | NUP37 | 2370097 6370435 6380008 | 6973 | 0.077 | -0.1089 | No | ||
| 24 | PSMB9 | 6980471 | 7156 | 0.072 | -0.1176 | No | ||
| 25 | B2M | 5080332 5130059 | 8057 | 0.048 | -0.1654 | No | ||
| 26 | TPR | 1990066 6550390 | 8090 | 0.047 | -0.1664 | No | ||
| 27 | PSMA3 | 5900047 7040161 | 8176 | 0.045 | -0.1703 | No | ||
| 28 | PSMC3 | 2480184 | 8367 | 0.041 | -0.1799 | No | ||
| 29 | PSMD5 | 3940139 4570041 | 8769 | 0.033 | -0.2010 | No | ||
| 30 | NUP35 | 5340408 | 9660 | 0.018 | -0.2488 | No | ||
| 31 | AP2B1 | 1450184 2370148 3520139 4850593 | 9864 | 0.014 | -0.2595 | No | ||
| 32 | PSMA6 | 50609 | 10307 | 0.006 | -0.2832 | No | ||
| 33 | XPO1 | 540707 | 10863 | -0.002 | -0.3131 | No | ||
| 34 | PSMD8 | 630142 | 11013 | -0.005 | -0.3211 | No | ||
| 35 | RAN | 2260446 4590647 | 11827 | -0.019 | -0.3646 | No | ||
| 36 | NUP153 | 7000452 | 12531 | -0.035 | -0.4020 | No | ||
| 37 | PSMB5 | 6290242 | 13050 | -0.050 | -0.4292 | No | ||
| 38 | PSMD11 | 2340538 6510053 | 13588 | -0.072 | -0.4571 | No | ||
| 39 | TCEB2 | 840204 1340400 1450082 | 14116 | -0.102 | -0.4839 | No | ||
| 40 | RBX1 | 2120010 2340047 | 14472 | -0.132 | -0.5010 | No | ||
| 41 | PSMC2 | 7040010 | 14507 | -0.135 | -0.5008 | No | ||
| 42 | RAE1 | 7050121 | 14676 | -0.154 | -0.5075 | No | ||
| 43 | CDK9 | 630707 | 15436 | -0.290 | -0.5439 | No | ||
| 44 | PSMB2 | 940035 4210324 | 15519 | -0.313 | -0.5435 | No | ||
| 45 | PSMB1 | 2940402 | 15530 | -0.317 | -0.5392 | No | ||
| 46 | RANBP1 | 430215 1090180 | 15639 | -0.349 | -0.5397 | No | ||
| 47 | RANBP2 | 4280338 | 15909 | -0.437 | -0.5475 | No | ||
| 48 | NUP54 | 940546 2360156 4060278 | 16051 | -0.483 | -0.5476 | Yes | ||
| 49 | PSME3 | 2810537 | 16141 | -0.515 | -0.5445 | Yes | ||
| 50 | PSMC4 | 580050 1580025 | 16153 | -0.518 | -0.5372 | Yes | ||
| 51 | PSMC6 | 2810021 | 16260 | -0.560 | -0.5343 | Yes | ||
| 52 | PSMC5 | 2760315 6550021 | 16473 | -0.650 | -0.5357 | Yes | ||
| 53 | NUPL2 | 6550537 | 16690 | -0.772 | -0.5355 | Yes | ||
| 54 | PSMD3 | 1400647 | 16762 | -0.811 | -0.5269 | Yes | ||
| 55 | PSME1 | 450193 4480035 | 16780 | -0.823 | -0.5151 | Yes | ||
| 56 | NUP43 | 3360482 | 16806 | -0.839 | -0.5036 | Yes | ||
| 57 | CD28 | 1400739 4210093 | 17038 | -0.983 | -0.5009 | Yes | ||
| 58 | PSMD4 | 430068 | 17380 | -1.214 | -0.5007 | Yes | ||
| 59 | NUP160 | 1990551 | 17608 | -1.419 | -0.4911 | Yes | ||
| 60 | NUP155 | 5720576 6220114 | 17688 | -1.497 | -0.4724 | Yes | ||
| 61 | PSMD10 | 520494 1170576 3830050 | 17774 | -1.611 | -0.4522 | Yes | ||
| 62 | ARF1 | 3840291 | 17892 | -1.718 | -0.4321 | Yes | ||
| 63 | PAK2 | 360438 7050068 | 17948 | -1.783 | -0.4076 | Yes | ||
| 64 | AP1G1 | 2360671 | 17963 | -1.793 | -0.3808 | Yes | ||
| 65 | PSMD12 | 730044 | 18128 | -2.007 | -0.3588 | Yes | ||
| 66 | NUP93 | 2190273 | 18219 | -2.143 | -0.3308 | Yes | ||
| 67 | PSMA2 | 6510093 | 18263 | -2.215 | -0.2990 | Yes | ||
| 68 | KPNA1 | 5270324 | 18312 | -2.308 | -0.2662 | Yes | ||
| 69 | PSMD7 | 2030619 6220594 | 18323 | -2.337 | -0.2308 | Yes | ||
| 70 | PSMA4 | 4560427 | 18418 | -2.539 | -0.1968 | Yes | ||
| 71 | NUP107 | 6380021 | 18420 | -2.542 | -0.1578 | Yes | ||
| 72 | TCEB1 | 1170619 | 18440 | -2.605 | -0.1188 | Yes | ||
| 73 | CD4 | 1090010 | 18469 | -2.701 | -0.0788 | Yes | ||
| 74 | PSMD14 | 5690593 | 18497 | -2.806 | -0.0371 | Yes | ||
| 75 | KPNB1 | 1690138 | 18506 | -2.828 | 0.0059 | Yes |