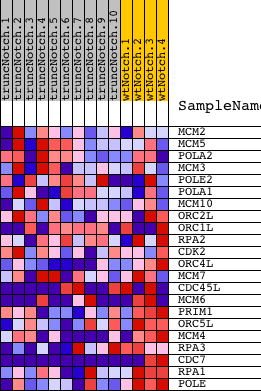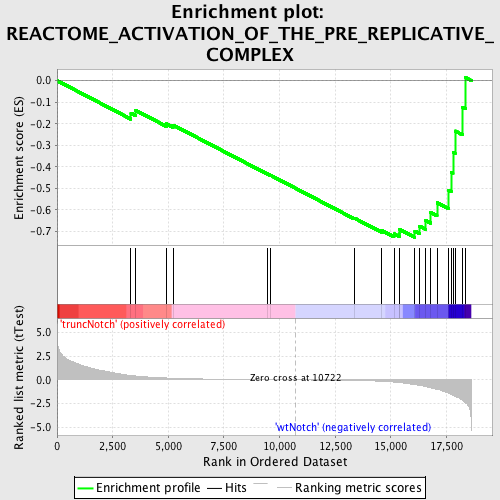
Profile of the Running ES Score & Positions of GeneSet Members on the Rank Ordered List
| Dataset | Set_03_truncNotch_versus_wtNotch.phenotype_truncNotch_versus_wtNotch.cls #truncNotch_versus_wtNotch |
| Phenotype | phenotype_truncNotch_versus_wtNotch.cls#truncNotch_versus_wtNotch |
| Upregulated in class | wtNotch |
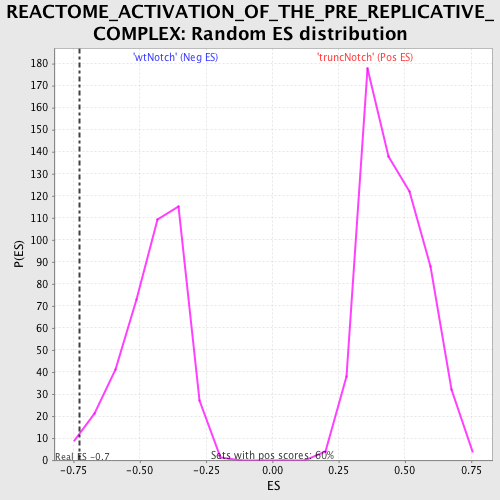
| GeneSet | REACTOME_ACTIVATION_OF_THE_PRE_REPLICATIVE_COMPLEX |
| Enrichment Score (ES) | -0.7276402 |
| Normalized Enrichment Score (NES) | -1.6212397 |
| Nominal p-value | 0.012626262 |
| FDR q-value | 0.21010704 |
| FWER p-Value | 0.898 |
| PROBE | DESCRIPTION (from dataset) | GENE SYMBOL | GENE_TITLE | RANK IN GENE LIST | RANK METRIC SCORE | RUNNING ES | CORE ENRICHMENT | |
|---|---|---|---|---|---|---|---|---|
| 1 | MCM2 | 5050139 | 3319 | 0.459 | -0.1510 | No | ||
| 2 | MCM5 | 2680647 | 3531 | 0.411 | -0.1378 | No | ||
| 3 | POLA2 | 940519 | 4916 | 0.200 | -0.2003 | No | ||
| 4 | MCM3 | 5570068 | 5213 | 0.172 | -0.2059 | No | ||
| 5 | POLE2 | 6110041 | 9434 | 0.021 | -0.4316 | No | ||
| 6 | POLA1 | 4760541 | 9609 | 0.018 | -0.4398 | No | ||
| 7 | MCM10 | 4920632 | 13362 | -0.062 | -0.6379 | No | ||
| 8 | ORC2L | 1990470 6510019 | 14587 | -0.144 | -0.6951 | No | ||
| 9 | ORC1L | 2370328 6110390 | 15143 | -0.230 | -0.7113 | Yes | ||
| 10 | RPA2 | 2760301 5420195 | 15395 | -0.283 | -0.7078 | Yes | ||
| 11 | CDK2 | 130484 2260301 4010088 5050110 | 15400 | -0.284 | -0.6911 | Yes | ||
| 12 | ORC4L | 4230538 5550288 | 16081 | -0.494 | -0.6981 | Yes | ||
| 13 | MCM7 | 3290292 5220056 | 16282 | -0.569 | -0.6748 | Yes | ||
| 14 | CDC45L | 70537 3130114 | 16566 | -0.690 | -0.6488 | Yes | ||
| 15 | MCM6 | 60092 540181 6510110 | 16794 | -0.831 | -0.6114 | Yes | ||
| 16 | PRIM1 | 6420746 | 17077 | -0.999 | -0.5668 | Yes | ||
| 17 | ORC5L | 1940133 1940711 | 17603 | -1.414 | -0.5105 | Yes | ||
| 18 | MCM4 | 2760673 5420711 | 17712 | -1.538 | -0.4243 | Yes | ||
| 19 | RPA3 | 5700136 | 17795 | -1.631 | -0.3312 | Yes | ||
| 20 | CDC7 | 4060546 4850041 | 17891 | -1.718 | -0.2336 | Yes | ||
| 21 | RPA1 | 360452 | 18231 | -2.159 | -0.1227 | Yes | ||
| 22 | POLE | 6020538 | 18351 | -2.398 | 0.0143 | Yes |