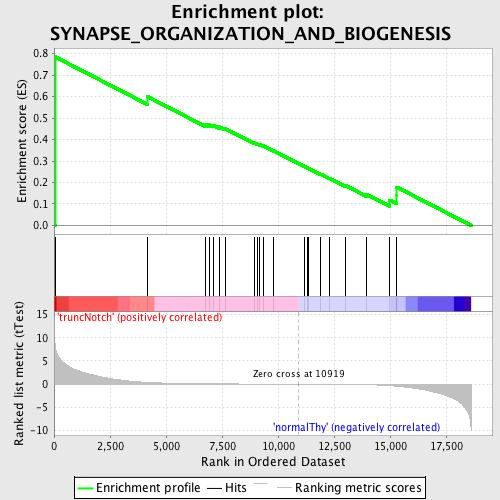
Profile of the Running ES Score & Positions of GeneSet Members on the Rank Ordered List
| Dataset | Set_03_truncNotch_versus_normalThy.phenotype_truncNotch_versus_normalThy.cls #truncNotch_versus_normalThy.phenotype_truncNotch_versus_normalThy.cls #truncNotch_versus_normalThy_repos |
| Phenotype | phenotype_truncNotch_versus_normalThy.cls#truncNotch_versus_normalThy_repos |
| Upregulated in class | truncNotch |
| GeneSet | SYNAPSE_ORGANIZATION_AND_BIOGENESIS |
| Enrichment Score (ES) | 0.78538597 |
| Normalized Enrichment Score (NES) | 1.5707595 |
| Nominal p-value | 0.005319149 |
| FDR q-value | 0.14917608 |
| FWER p-Value | 0.945 |
| PROBE | DESCRIPTION (from dataset) | GENE SYMBOL | GENE_TITLE | RANK IN GENE LIST | RANK METRIC SCORE | RUNNING ES | CORE ENRICHMENT | |
|---|---|---|---|---|---|---|---|---|
| 1 | AGRN | 6770152 | 44 | 8.461 | 0.7854 | Yes | ||
| 2 | KLK8 | 60035 2340440 | 4157 | 0.391 | 0.6006 | No | ||
| 3 | PCDHB3 | 450725 | 6774 | 0.095 | 0.4688 | No | ||
| 4 | PCDHB14 | 2370411 | 6937 | 0.089 | 0.4683 | No | ||
| 5 | PCDHB9 | 4230102 | 7106 | 0.081 | 0.4668 | No | ||
| 6 | PCDHB4 | 670184 | 7379 | 0.071 | 0.4588 | No | ||
| 7 | PCDHB6 | 6420181 | 7636 | 0.064 | 0.4510 | No | ||
| 8 | POU4F1 | 2260315 | 8933 | 0.033 | 0.3844 | No | ||
| 9 | PCDHB16 | 4200048 | 9080 | 0.031 | 0.3795 | No | ||
| 10 | COL4A4 | 1050541 | 9184 | 0.029 | 0.3766 | No | ||
| 11 | PCDHB5 | 2060600 | 9326 | 0.027 | 0.3715 | No | ||
| 12 | CHRNA1 | 1170025 3610364 5220292 | 9795 | 0.019 | 0.3481 | No | ||
| 13 | PCDHB11 | 610114 | 11197 | -0.005 | 0.2731 | No | ||
| 14 | PCDHB13 | 6840082 | 11327 | -0.007 | 0.2668 | No | ||
| 15 | PCDHB2 | 460121 | 11355 | -0.007 | 0.2661 | No | ||
| 16 | PCDHB10 | 4760040 | 11904 | -0.018 | 0.2383 | No | ||
| 17 | NLGN1 | 5670278 | 12290 | -0.027 | 0.2201 | No | ||
| 18 | ACHE | 5290750 | 12986 | -0.047 | 0.1871 | No | ||
| 19 | GHRL | 2360619 6760438 | 13932 | -0.102 | 0.1457 | No | ||
| 20 | UBB | 4810138 | 14980 | -0.307 | 0.1180 | No | ||
| 21 | CACNB2 | 1500095 7330707 | 15282 | -0.415 | 0.1404 | No | ||
| 22 | NRD1 | 5900017 | 15285 | -0.417 | 0.1791 | No |

