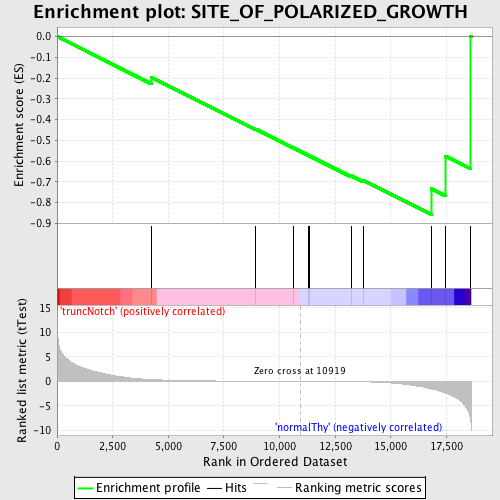
Profile of the Running ES Score & Positions of GeneSet Members on the Rank Ordered List
| Dataset | Set_03_truncNotch_versus_normalThy.phenotype_truncNotch_versus_normalThy.cls #truncNotch_versus_normalThy.phenotype_truncNotch_versus_normalThy.cls #truncNotch_versus_normalThy_repos |
| Phenotype | phenotype_truncNotch_versus_normalThy.cls#truncNotch_versus_normalThy_repos |
| Upregulated in class | normalThy |
| GeneSet | SITE_OF_POLARIZED_GROWTH |
| Enrichment Score (ES) | -0.8571219 |
| Normalized Enrichment Score (NES) | -1.5175253 |
| Nominal p-value | 0.013574661 |
| FDR q-value | 0.5638403 |
| FWER p-Value | 1.0 |
| PROBE | DESCRIPTION (from dataset) | GENE SYMBOL | GENE_TITLE | RANK IN GENE LIST | RANK METRIC SCORE | RUNNING ES | CORE ENRICHMENT | |
|---|---|---|---|---|---|---|---|---|
| 1 | OTX2 | 1190471 | 4240 | 0.372 | -0.1977 | No | ||
| 2 | NRSN1 | 6290528 | 8920 | 0.034 | -0.4464 | No | ||
| 3 | PRKCI | 5420139 | 10603 | 0.006 | -0.5363 | No | ||
| 4 | APBB2 | 5130403 | 11316 | -0.007 | -0.5741 | No | ||
| 5 | ERC2 | 5570739 | 11356 | -0.007 | -0.5756 | No | ||
| 6 | MAPT | 360706 1230706 | 13214 | -0.056 | -0.6708 | No | ||
| 7 | APBB1 | 2690338 | 13757 | -0.088 | -0.6928 | No | ||
| 8 | THY1 | 5910162 | 16816 | -1.530 | -0.7328 | Yes | ||
| 9 | CDK5 | 940348 | 17457 | -2.346 | -0.5765 | Yes | ||
| 10 | CDK5R1 | 3870161 | 18581 | -7.857 | 0.0019 | Yes |

