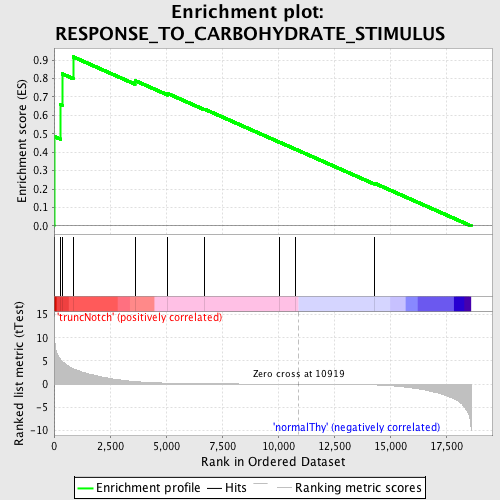
Profile of the Running ES Score & Positions of GeneSet Members on the Rank Ordered List
| Dataset | Set_03_truncNotch_versus_normalThy.phenotype_truncNotch_versus_normalThy.cls #truncNotch_versus_normalThy.phenotype_truncNotch_versus_normalThy.cls #truncNotch_versus_normalThy_repos |
| Phenotype | phenotype_truncNotch_versus_normalThy.cls#truncNotch_versus_normalThy_repos |
| Upregulated in class | truncNotch |
| GeneSet | RESPONSE_TO_CARBOHYDRATE_STIMULUS |
| Enrichment Score (ES) | 0.9175579 |
| Normalized Enrichment Score (NES) | 1.5843852 |
| Nominal p-value | 0.0036036037 |
| FDR q-value | 0.14973499 |
| FWER p-Value | 0.905 |
| PROBE | DESCRIPTION (from dataset) | GENE SYMBOL | GENE_TITLE | RANK IN GENE LIST | RANK METRIC SCORE | RUNNING ES | CORE ENRICHMENT | |
|---|---|---|---|---|---|---|---|---|
| 1 | EIF2B5 | 430315 6900400 | 2 | 13.689 | 0.4859 | Yes | ||
| 2 | EIF2B3 | 3290463 | 289 | 5.263 | 0.6574 | Yes | ||
| 3 | EIF2B2 | 4290048 | 363 | 4.843 | 0.8255 | Yes | ||
| 4 | EIF2B1 | 4610082 7040242 | 851 | 3.330 | 0.9176 | Yes | ||
| 5 | CLEC7A | 1990121 3450736 3800064 4610035 | 3612 | 0.552 | 0.7888 | No | ||
| 6 | APOA2 | 6510364 6860411 | 5076 | 0.229 | 0.7183 | No | ||
| 7 | EIF2B4 | 5270082 | 6726 | 0.097 | 0.6332 | No | ||
| 8 | GCK | 2370273 | 10061 | 0.014 | 0.4545 | No | ||
| 9 | GYS2 | 2570736 | 10777 | 0.002 | 0.4162 | No | ||
| 10 | MAFA | 70519 | 14290 | -0.143 | 0.2325 | No |

