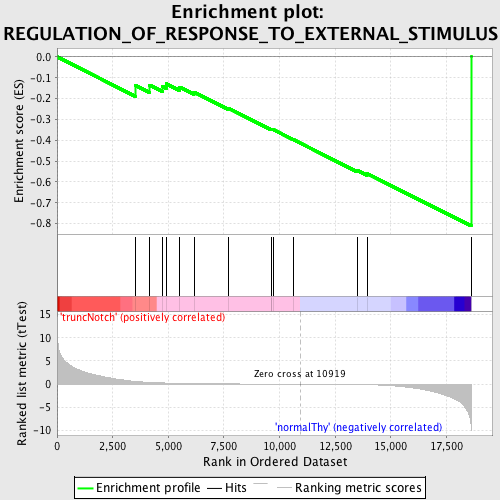
Profile of the Running ES Score & Positions of GeneSet Members on the Rank Ordered List
| Dataset | Set_03_truncNotch_versus_normalThy.phenotype_truncNotch_versus_normalThy.cls #truncNotch_versus_normalThy.phenotype_truncNotch_versus_normalThy.cls #truncNotch_versus_normalThy_repos |
| Phenotype | phenotype_truncNotch_versus_normalThy.cls#truncNotch_versus_normalThy_repos |
| Upregulated in class | normalThy |
| GeneSet | REGULATION_OF_RESPONSE_TO_EXTERNAL_STIMULUS |
| Enrichment Score (ES) | -0.810989 |
| Normalized Enrichment Score (NES) | -1.55309 |
| Nominal p-value | 0.027027028 |
| FDR q-value | 0.4793232 |
| FWER p-Value | 0.992 |
| PROBE | DESCRIPTION (from dataset) | GENE SYMBOL | GENE_TITLE | RANK IN GENE LIST | RANK METRIC SCORE | RUNNING ES | CORE ENRICHMENT | |
|---|---|---|---|---|---|---|---|---|
| 1 | SCG2 | 5670438 130671 | 3511 | 0.596 | -0.1357 | No | ||
| 2 | KLK8 | 60035 2340440 | 4157 | 0.391 | -0.1357 | No | ||
| 3 | CHRNA7 | 2970446 | 4732 | 0.277 | -0.1419 | No | ||
| 4 | AHSG | 6450014 | 4909 | 0.250 | -0.1292 | No | ||
| 5 | GHSR | 1980465 7050521 | 5504 | 0.180 | -0.1450 | No | ||
| 6 | CDH13 | 5130368 5340114 | 6153 | 0.127 | -0.1686 | No | ||
| 7 | CX3CL1 | 3990707 | 7685 | 0.063 | -0.2453 | No | ||
| 8 | IL20 | 4850647 | 9630 | 0.021 | -0.3479 | No | ||
| 9 | SLIT2 | 1940037 | 9637 | 0.021 | -0.3464 | No | ||
| 10 | NPY | 3170138 | 9710 | 0.020 | -0.3485 | No | ||
| 11 | LEP | 4010053 | 10635 | 0.005 | -0.3977 | No | ||
| 12 | CARTPT | 6660687 | 13504 | -0.071 | -0.5456 | No | ||
| 13 | GHRL | 2360619 6760438 | 13932 | -0.102 | -0.5595 | Yes | ||
| 14 | TNFRSF1A | 1090390 6520735 | 18612 | -9.119 | 0.0002 | Yes |

