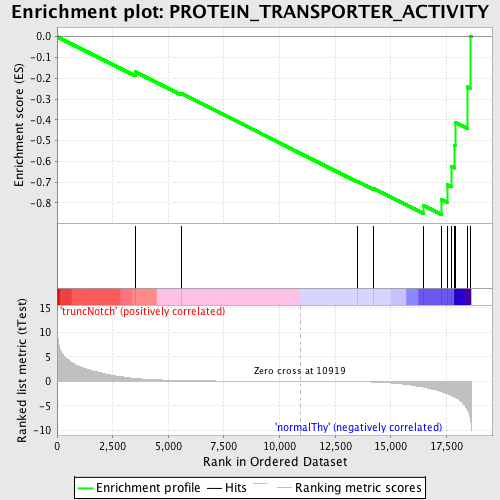
Profile of the Running ES Score & Positions of GeneSet Members on the Rank Ordered List
| Dataset | Set_03_truncNotch_versus_normalThy.phenotype_truncNotch_versus_normalThy.cls #truncNotch_versus_normalThy.phenotype_truncNotch_versus_normalThy.cls #truncNotch_versus_normalThy_repos |
| Phenotype | phenotype_truncNotch_versus_normalThy.cls#truncNotch_versus_normalThy_repos |
| Upregulated in class | normalThy |
| GeneSet | PROTEIN_TRANSPORTER_ACTIVITY |
| Enrichment Score (ES) | -0.8562391 |
| Normalized Enrichment Score (NES) | -1.5566279 |
| Nominal p-value | 0.0043763677 |
| FDR q-value | 0.5482986 |
| FWER p-Value | 0.99 |

| PROBE | DESCRIPTION (from dataset) | GENE SYMBOL | GENE_TITLE | RANK IN GENE LIST | RANK METRIC SCORE | RUNNING ES | CORE ENRICHMENT | |
|---|---|---|---|---|---|---|---|---|
| 1 | SEC61B | 840113 4540687 | 3517 | 0.594 | -0.1687 | No | ||
| 2 | CCT6B | 3190411 | 5568 | 0.175 | -0.2729 | No | ||
| 3 | COG2 | 5900129 | 13508 | -0.071 | -0.6972 | No | ||
| 4 | ZFYVE16 | 3450739 | 14218 | -0.130 | -0.7308 | No | ||
| 5 | IPO9 | 4560132 | 16457 | -1.140 | -0.8121 | Yes | ||
| 6 | XPO6 | 3940019 | 17279 | -2.089 | -0.7847 | Yes | ||
| 7 | COG3 | 3840746 | 17531 | -2.485 | -0.7132 | Yes | ||
| 8 | RAMP1 | 2320168 | 17730 | -2.882 | -0.6251 | Yes | ||
| 9 | EIF4ENIF1 | 2060341 | 17867 | -3.193 | -0.5232 | Yes | ||
| 10 | TSNAX | 3450279 | 17918 | -3.301 | -0.4128 | Yes | ||
| 11 | MCL1 | 1660672 | 18445 | -5.818 | -0.2419 | Yes | ||
| 12 | ABCG1 | 60692 | 18562 | -7.335 | 0.0029 | Yes |

