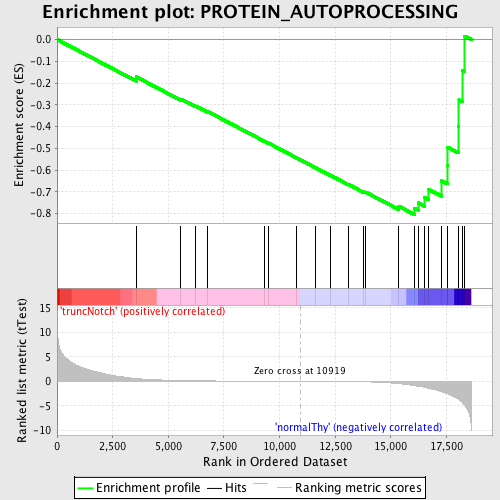
Profile of the Running ES Score & Positions of GeneSet Members on the Rank Ordered List
| Dataset | Set_03_truncNotch_versus_normalThy.phenotype_truncNotch_versus_normalThy.cls #truncNotch_versus_normalThy.phenotype_truncNotch_versus_normalThy.cls #truncNotch_versus_normalThy_repos |
| Phenotype | phenotype_truncNotch_versus_normalThy.cls#truncNotch_versus_normalThy_repos |
| Upregulated in class | normalThy |
| GeneSet | PROTEIN_AUTOPROCESSING |
| Enrichment Score (ES) | -0.8041192 |
| Normalized Enrichment Score (NES) | -1.7048619 |
| Nominal p-value | 0.0023923444 |
| FDR q-value | 0.39615816 |
| FWER p-Value | 0.316 |
| PROBE | DESCRIPTION (from dataset) | GENE SYMBOL | GENE_TITLE | RANK IN GENE LIST | RANK METRIC SCORE | RUNNING ES | CORE ENRICHMENT | |
|---|---|---|---|---|---|---|---|---|
| 1 | MAP3K10 | 3360168 4850180 | 3551 | 0.583 | -0.1714 | No | ||
| 2 | TTN | 2320161 4670056 6550026 | 5559 | 0.175 | -0.2735 | No | ||
| 3 | MAP3K9 | 3290707 | 6233 | 0.122 | -0.3056 | No | ||
| 4 | TNK1 | 4730279 | 6778 | 0.095 | -0.3316 | No | ||
| 5 | AKT1 | 5290746 | 9328 | 0.027 | -0.4678 | No | ||
| 6 | MAP3K13 | 3190017 | 9487 | 0.024 | -0.4755 | No | ||
| 7 | MYO3A | 5290494 | 10754 | 0.003 | -0.5435 | No | ||
| 8 | PCSK9 | 3120044 | 11631 | -0.013 | -0.5902 | No | ||
| 9 | MAP3K12 | 2470373 6420162 | 12296 | -0.027 | -0.6250 | No | ||
| 10 | CDKL5 | 2450070 | 13087 | -0.051 | -0.6658 | No | ||
| 11 | INSR | 1190504 | 13765 | -0.089 | -0.6992 | No | ||
| 12 | PAK1 | 4540315 | 13880 | -0.097 | -0.7021 | No | ||
| 13 | UHMK1 | 3850670 6450064 | 15364 | -0.455 | -0.7666 | No | ||
| 14 | LMTK2 | 6650692 | 16063 | -0.867 | -0.7750 | Yes | ||
| 15 | IGF1R | 3360494 | 16227 | -0.973 | -0.7510 | Yes | ||
| 16 | CAMKK2 | 5270047 | 16525 | -1.210 | -0.7263 | Yes | ||
| 17 | CRKRS | 510537 2510551 | 16710 | -1.390 | -0.6895 | Yes | ||
| 18 | MAP3K11 | 7000039 | 17284 | -2.094 | -0.6499 | Yes | ||
| 19 | PAK2 | 360438 7050068 | 17539 | -2.495 | -0.5797 | Yes | ||
| 20 | EIF2AK1 | 2470301 | 17562 | -2.537 | -0.4956 | Yes | ||
| 21 | EIF2AK3 | 4280161 | 18028 | -3.584 | -0.4001 | Yes | ||
| 22 | STK4 | 2640152 | 18063 | -3.692 | -0.2779 | Yes | ||
| 23 | MAP3K3 | 610685 | 18209 | -4.252 | -0.1427 | Yes | ||
| 24 | DYRK1A | 3190181 | 18327 | -4.895 | 0.0155 | Yes |

