Profile of the Running ES Score & Positions of GeneSet Members on the Rank Ordered List
| Dataset | Set_03_truncNotch_versus_normalThy.phenotype_truncNotch_versus_normalThy.cls #truncNotch_versus_normalThy.phenotype_truncNotch_versus_normalThy.cls #truncNotch_versus_normalThy_repos |
| Phenotype | phenotype_truncNotch_versus_normalThy.cls#truncNotch_versus_normalThy_repos |
| Upregulated in class | normalThy |
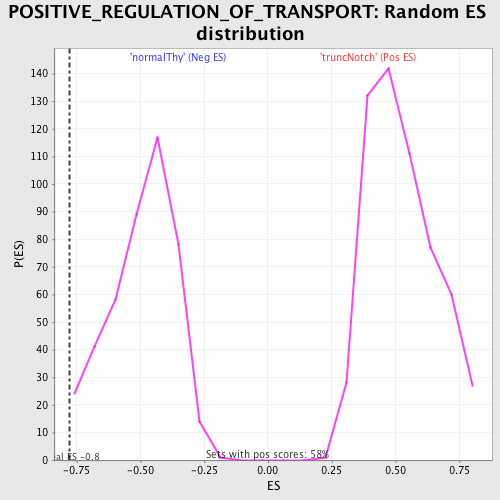
| GeneSet | POSITIVE_REGULATION_OF_TRANSPORT |
| Enrichment Score (ES) | -0.77641815 |
| Normalized Enrichment Score (NES) | -1.5722036 |
| Nominal p-value | 0.014218009 |
| FDR q-value | 0.5488555 |
| FWER p-Value | 0.977 |
| PROBE | DESCRIPTION (from dataset) | GENE SYMBOL | GENE_TITLE | RANK IN GENE LIST | RANK METRIC SCORE | RUNNING ES | CORE ENRICHMENT | |
|---|---|---|---|---|---|---|---|---|
| 1 | NCBP2 | 5340500 | 2136 | 1.552 | -0.0507 | No | ||
| 2 | CDH1 | 1940736 | 4652 | 0.291 | -0.1739 | No | ||
| 3 | AHSG | 6450014 | 4909 | 0.250 | -0.1774 | No | ||
| 4 | SPACA3 | 1850161 | 5484 | 0.182 | -0.2007 | No | ||
| 5 | GATA2 | 6590280 | 8822 | 0.036 | -0.3786 | No | ||
| 6 | GCK | 2370273 | 10061 | 0.014 | -0.4446 | No | ||
| 7 | SFTPD | 6510181 | 11406 | -0.008 | -0.5165 | No | ||
| 8 | GHRH | 4570575 | 12947 | -0.045 | -0.5974 | No | ||
| 9 | CARTPT | 6660687 | 13504 | -0.071 | -0.6244 | No | ||
| 10 | GHRL | 2360619 6760438 | 13932 | -0.102 | -0.6432 | No | ||
| 11 | TRIP6 | 6520609 | 14113 | -0.119 | -0.6479 | No | ||
| 12 | TNFSF14 | 1450369 5550594 | 15476 | -0.515 | -0.6999 | No | ||
| 13 | SMAD3 | 6450671 | 16901 | -1.640 | -0.7087 | Yes | ||
| 14 | FLNA | 5390193 | 17371 | -2.220 | -0.6421 | Yes | ||
| 15 | GSK3B | 5360348 | 18027 | -3.582 | -0.5293 | Yes | ||
| 16 | CBL | 6380068 | 18068 | -3.711 | -0.3781 | Yes | ||
| 17 | STIM1 | 6380138 | 18263 | -4.554 | -0.2003 | Yes | ||
| 18 | PPT1 | 6450440 | 18382 | -5.304 | 0.0126 | Yes |