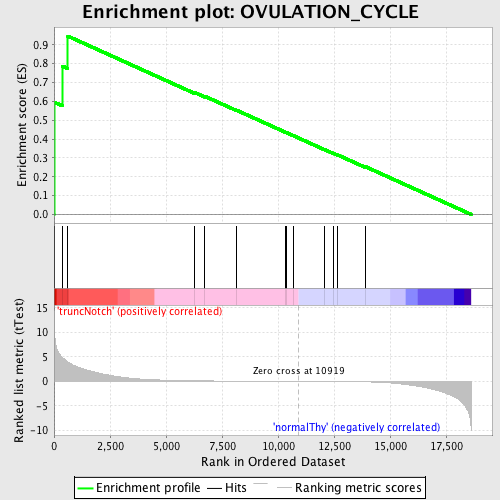
Profile of the Running ES Score & Positions of GeneSet Members on the Rank Ordered List
| Dataset | Set_03_truncNotch_versus_normalThy.phenotype_truncNotch_versus_normalThy.cls #truncNotch_versus_normalThy.phenotype_truncNotch_versus_normalThy.cls #truncNotch_versus_normalThy_repos |
| Phenotype | phenotype_truncNotch_versus_normalThy.cls#truncNotch_versus_normalThy_repos |
| Upregulated in class | truncNotch |
| GeneSet | OVULATION_CYCLE |
| Enrichment Score (ES) | 0.94644433 |
| Normalized Enrichment Score (NES) | 1.7049328 |
| Nominal p-value | 0.0 |
| FDR q-value | 0.14885607 |
| FWER p-Value | 0.149 |
| PROBE | DESCRIPTION (from dataset) | GENE SYMBOL | GENE_TITLE | RANK IN GENE LIST | RANK METRIC SCORE | RUNNING ES | CORE ENRICHMENT | |
|---|---|---|---|---|---|---|---|---|
| 1 | EIF2B5 | 430315 6900400 | 2 | 13.689 | 0.5959 | Yes | ||
| 2 | EIF2B2 | 4290048 | 363 | 4.843 | 0.7874 | Yes | ||
| 3 | SOD1 | 5890070 | 612 | 3.959 | 0.9464 | Yes | ||
| 4 | SPRR2G | 6550519 | 6279 | 0.119 | 0.6471 | No | ||
| 5 | EIF2B4 | 5270082 | 6726 | 0.097 | 0.6273 | No | ||
| 6 | SPRR2A | 360632 | 8156 | 0.050 | 0.5527 | No | ||
| 7 | SPRR2D | 1340458 | 10348 | 0.010 | 0.4353 | No | ||
| 8 | SPRR2E | 6620100 | 10365 | 0.009 | 0.4349 | No | ||
| 9 | BMPR1B | 4560010 4760121 6450161 | 10701 | 0.004 | 0.4170 | No | ||
| 10 | EREG | 50519 4920129 | 12085 | -0.022 | 0.3437 | No | ||
| 11 | SPRR2B | 60037 | 12483 | -0.032 | 0.3237 | No | ||
| 12 | SPRR2F | 670551 | 12665 | -0.036 | 0.3156 | No | ||
| 13 | FOXL2 | 5670537 | 13898 | -0.098 | 0.2536 | No |

