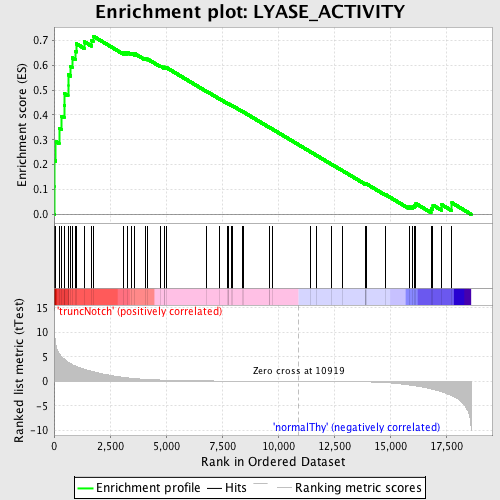
Profile of the Running ES Score & Positions of GeneSet Members on the Rank Ordered List
| Dataset | Set_03_truncNotch_versus_normalThy.phenotype_truncNotch_versus_normalThy.cls #truncNotch_versus_normalThy.phenotype_truncNotch_versus_normalThy.cls #truncNotch_versus_normalThy_repos |
| Phenotype | phenotype_truncNotch_versus_normalThy.cls#truncNotch_versus_normalThy_repos |
| Upregulated in class | truncNotch |
| GeneSet | LYASE_ACTIVITY |
| Enrichment Score (ES) | 0.71700644 |
| Normalized Enrichment Score (NES) | 1.6995072 |
| Nominal p-value | 0.0 |
| FDR q-value | 0.08619279 |
| FWER p-Value | 0.171 |
| PROBE | DESCRIPTION (from dataset) | GENE SYMBOL | GENE_TITLE | RANK IN GENE LIST | RANK METRIC SCORE | RUNNING ES | CORE ENRICHMENT | |
|---|---|---|---|---|---|---|---|---|
| 1 | ALDOA | 6290672 | 14 | 10.281 | 0.1110 | Yes | ||
| 2 | ALAD | 780576 | 20 | 9.716 | 0.2163 | Yes | ||
| 3 | NTHL1 | 4920148 | 83 | 7.244 | 0.2917 | Yes | ||
| 4 | ADSL | 5570484 | 223 | 5.722 | 0.3463 | Yes | ||
| 5 | APEX1 | 3190519 | 339 | 4.957 | 0.3940 | Yes | ||
| 6 | ENO3 | 5270136 | 448 | 4.550 | 0.4376 | Yes | ||
| 7 | DDC | 670408 | 470 | 4.468 | 0.4851 | Yes | ||
| 8 | UMPS | 2340541 4730438 | 621 | 3.938 | 0.5198 | Yes | ||
| 9 | MLYCD | 6760181 | 623 | 3.935 | 0.5625 | Yes | ||
| 10 | ECHS1 | 2970184 | 741 | 3.628 | 0.5956 | Yes | ||
| 11 | MVD | 2060717 | 806 | 3.437 | 0.6295 | Yes | ||
| 12 | SCLY | 730497 | 957 | 3.119 | 0.6553 | Yes | ||
| 13 | ENO1 | 5340128 | 1000 | 3.040 | 0.6861 | Yes | ||
| 14 | LTC4S | 2570411 | 1343 | 2.473 | 0.6945 | Yes | ||
| 15 | BCKDHA | 50189 | 1670 | 2.054 | 0.6993 | Yes | ||
| 16 | ACO1 | 50114 | 1742 | 1.982 | 0.7170 | Yes | ||
| 17 | CBS | 5420450 6660039 | 3115 | 0.806 | 0.6518 | No | ||
| 18 | BCKDHB | 780372 | 3257 | 0.718 | 0.6521 | No | ||
| 19 | GGCX | 770377 3990441 | 3458 | 0.619 | 0.6480 | No | ||
| 20 | CA1 | 1340204 | 3604 | 0.555 | 0.6462 | No | ||
| 21 | UROD | 2470494 | 4057 | 0.417 | 0.6264 | No | ||
| 22 | ASL | 1240601 5340309 5360082 | 4162 | 0.390 | 0.6250 | No | ||
| 23 | CA2 | 1660113 1660600 | 4747 | 0.273 | 0.5966 | No | ||
| 24 | CA4 | 130100 | 4907 | 0.250 | 0.5907 | No | ||
| 25 | GAD1 | 2360035 3140167 | 4919 | 0.249 | 0.5928 | No | ||
| 26 | OGG1 | 1940279 | 5007 | 0.238 | 0.5907 | No | ||
| 27 | GUCY1A2 | 1660441 | 6803 | 0.094 | 0.4950 | No | ||
| 28 | HADHA | 3190041 | 7390 | 0.071 | 0.4642 | No | ||
| 29 | PCK1 | 7000358 | 7734 | 0.061 | 0.4464 | No | ||
| 30 | AMD1 | 6290128 | 7786 | 0.060 | 0.4443 | No | ||
| 31 | ODC1 | 5670168 | 7800 | 0.059 | 0.4443 | No | ||
| 32 | ADCY8 | 6760519 | 7919 | 0.056 | 0.4385 | No | ||
| 33 | SDS | 110242 6380725 | 7984 | 0.055 | 0.4357 | No | ||
| 34 | ACMSD | 1450538 | 8427 | 0.044 | 0.4123 | No | ||
| 35 | HCCS | 670397 3170341 | 8437 | 0.044 | 0.4123 | No | ||
| 36 | CRYM | 3940528 | 9599 | 0.022 | 0.3500 | No | ||
| 37 | GUCY2F | 2450309 | 9604 | 0.022 | 0.3500 | No | ||
| 38 | GUCY1A3 | 110253 2640735 4070037 | 9767 | 0.019 | 0.3415 | No | ||
| 39 | AUH | 5570152 | 11459 | -0.009 | 0.2505 | No | ||
| 40 | ALDOB | 4730324 | 11701 | -0.014 | 0.2377 | No | ||
| 41 | GUCY2C | 110411 6110156 | 12383 | -0.029 | 0.2013 | No | ||
| 42 | HDC | 4150463 | 12869 | -0.043 | 0.1757 | No | ||
| 43 | GUCY1B3 | 2970020 | 13905 | -0.098 | 0.1210 | No | ||
| 44 | CA3 | 870687 5890390 | 13910 | -0.099 | 0.1218 | No | ||
| 45 | ALDOC | 450121 610427 | 13912 | -0.100 | 0.1229 | No | ||
| 46 | HADHB | 60064 2690670 | 13927 | -0.101 | 0.1232 | No | ||
| 47 | ADCY7 | 6290520 7560739 | 14778 | -0.247 | 0.0801 | No | ||
| 48 | GLO1 | 7040692 | 15858 | -0.724 | 0.0298 | No | ||
| 49 | FECH | 2810605 3120088 4920411 | 16014 | -0.824 | 0.0304 | No | ||
| 50 | EHHADH | 6200315 | 16094 | -0.893 | 0.0359 | No | ||
| 51 | ADCY9 | 5690168 | 16150 | -0.932 | 0.0430 | No | ||
| 52 | GMDS | 1050519 | 16827 | -1.542 | 0.0234 | No | ||
| 53 | ENO2 | 2320068 | 16910 | -1.647 | 0.0369 | No | ||
| 54 | ECH1 | 4120746 | 17297 | -2.112 | 0.0390 | No | ||
| 55 | PTS | 1500270 | 17757 | -2.943 | 0.0463 | No |

