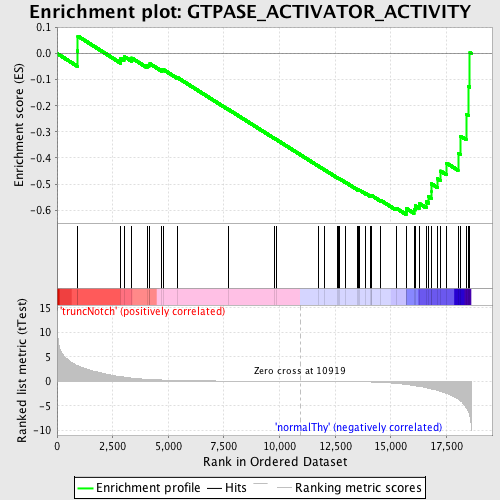
Profile of the Running ES Score & Positions of GeneSet Members on the Rank Ordered List
| Dataset | Set_03_truncNotch_versus_normalThy.phenotype_truncNotch_versus_normalThy.cls #truncNotch_versus_normalThy.phenotype_truncNotch_versus_normalThy.cls #truncNotch_versus_normalThy_repos |
| Phenotype | phenotype_truncNotch_versus_normalThy.cls#truncNotch_versus_normalThy_repos |
| Upregulated in class | normalThy |
| GeneSet | GTPASE_ACTIVATOR_ACTIVITY |
| Enrichment Score (ES) | -0.6162357 |
| Normalized Enrichment Score (NES) | -1.5065155 |
| Nominal p-value | 0.012722646 |
| FDR q-value | 0.5154637 |
| FWER p-Value | 1.0 |
| PROBE | DESCRIPTION (from dataset) | GENE SYMBOL | GENE_TITLE | RANK IN GENE LIST | RANK METRIC SCORE | RUNNING ES | CORE ENRICHMENT | |
|---|---|---|---|---|---|---|---|---|
| 1 | RASAL1 | 3710112 | 908 | 3.208 | 0.0099 | No | ||
| 2 | CENTA1 | 2360128 5220037 | 934 | 3.157 | 0.0665 | No | ||
| 3 | RGS3 | 60670 540736 1340180 1500369 3390735 4010131 4610402 6380114 | 2860 | 0.973 | -0.0194 | No | ||
| 4 | BCR | 2260020 4230180 6040195 | 3008 | 0.877 | -0.0112 | No | ||
| 5 | GMIP | 6980193 | 3351 | 0.674 | -0.0172 | No | ||
| 6 | ARFGEF1 | 6760494 | 4046 | 0.420 | -0.0469 | No | ||
| 7 | ABR | 610079 1170609 3610195 5670050 | 4131 | 0.397 | -0.0442 | No | ||
| 8 | DLC1 | 1090632 6450594 | 4172 | 0.387 | -0.0392 | No | ||
| 9 | DOCK4 | 5910102 | 4708 | 0.280 | -0.0629 | No | ||
| 10 | CHN2 | 870528 | 4787 | 0.267 | -0.0622 | No | ||
| 11 | RGS6 | 6040601 | 5390 | 0.194 | -0.0911 | No | ||
| 12 | SOS1 | 7050338 | 7718 | 0.062 | -0.2152 | No | ||
| 13 | ALDH1A1 | 6520706 | 9775 | 0.019 | -0.3256 | No | ||
| 14 | RGS11 | 2360041 | 9859 | 0.017 | -0.3297 | No | ||
| 15 | RGS2 | 1090736 | 11769 | -0.016 | -0.4323 | No | ||
| 16 | DEPDC2 | 5220102 | 12025 | -0.021 | -0.4456 | No | ||
| 17 | RGS9 | 1050273 | 12584 | -0.034 | -0.4750 | No | ||
| 18 | RGS4 | 2970711 | 12640 | -0.036 | -0.4773 | No | ||
| 19 | ARHGAP5 | 2510619 3360035 | 12688 | -0.037 | -0.4792 | No | ||
| 20 | NF1 | 6980433 | 12956 | -0.046 | -0.4927 | No | ||
| 21 | ARHGAP10 | 510086 780324 | 13521 | -0.072 | -0.5218 | No | ||
| 22 | RASGRP3 | 6020504 | 13537 | -0.073 | -0.5213 | No | ||
| 23 | RGS20 | 4540541 4730086 | 13593 | -0.077 | -0.5228 | No | ||
| 24 | RGS1 | 4060347 4540181 | 13879 | -0.097 | -0.5364 | No | ||
| 25 | OPHN1 | 2360100 | 14068 | -0.114 | -0.5444 | No | ||
| 26 | CENTD2 | 60408 2510156 6100494 | 14122 | -0.120 | -0.5451 | No | ||
| 27 | RACGAP1 | 3990162 6620736 | 14126 | -0.120 | -0.5430 | No | ||
| 28 | RGS12 | 1190082 5390369 | 14554 | -0.189 | -0.5625 | No | ||
| 29 | CDC42EP2 | 540079 2970138 | 15233 | -0.396 | -0.5918 | No | ||
| 30 | SIPA1 | 5220687 | 15688 | -0.632 | -0.6046 | Yes | ||
| 31 | VAV3 | 1050731 2450242 2680653 | 15709 | -0.646 | -0.5939 | Yes | ||
| 32 | TSC2 | 1450494 | 16043 | -0.847 | -0.5963 | Yes | ||
| 33 | RASA4 | 110296 4200114 | 16096 | -0.895 | -0.5827 | Yes | ||
| 34 | BNIP2 | 1410475 6770088 | 16273 | -0.998 | -0.5739 | Yes | ||
| 35 | RANGAP1 | 2320593 6650601 | 16596 | -1.280 | -0.5677 | Yes | ||
| 36 | ARFGAP3 | 3390717 | 16691 | -1.364 | -0.5478 | Yes | ||
| 37 | THY1 | 5910162 | 16816 | -1.530 | -0.5264 | Yes | ||
| 38 | RGS16 | 780091 | 16822 | -1.534 | -0.4986 | Yes | ||
| 39 | RASA2 | 7100706 | 17106 | -1.854 | -0.4798 | Yes | ||
| 40 | RABGAP1 | 5050397 | 17233 | -2.010 | -0.4498 | Yes | ||
| 41 | RALBP1 | 4780632 | 17514 | -2.449 | -0.4199 | Yes | ||
| 42 | RASA1 | 1240315 | 18023 | -3.576 | -0.3817 | Yes | ||
| 43 | RASA3 | 2060465 | 18124 | -3.886 | -0.3159 | Yes | ||
| 44 | RGS14 | 380086 | 18385 | -5.328 | -0.2322 | Yes | ||
| 45 | ARHGAP4 | 1940022 | 18482 | -6.085 | -0.1258 | Yes | ||
| 46 | MYO9B | 1230435 3060358 | 18556 | -7.251 | 0.0032 | Yes |

