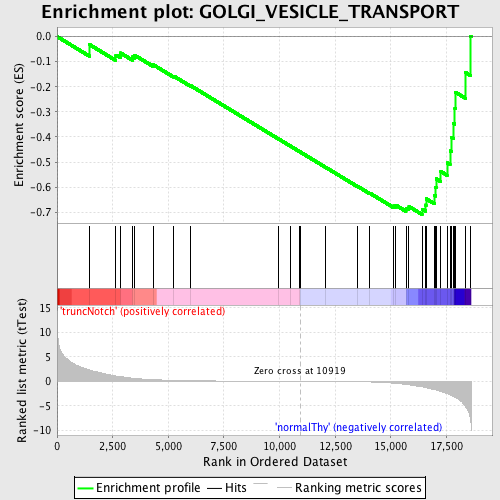
Profile of the Running ES Score & Positions of GeneSet Members on the Rank Ordered List
| Dataset | Set_03_truncNotch_versus_normalThy.phenotype_truncNotch_versus_normalThy.cls #truncNotch_versus_normalThy.phenotype_truncNotch_versus_normalThy.cls #truncNotch_versus_normalThy_repos |
| Phenotype | phenotype_truncNotch_versus_normalThy.cls#truncNotch_versus_normalThy_repos |
| Upregulated in class | normalThy |
| GeneSet | GOLGI_VESICLE_TRANSPORT |
| Enrichment Score (ES) | -0.7091314 |
| Normalized Enrichment Score (NES) | -1.5977741 |
| Nominal p-value | 0.0023584906 |
| FDR q-value | 0.49639148 |
| FWER p-Value | 0.933 |

| PROBE | DESCRIPTION (from dataset) | GENE SYMBOL | GENE_TITLE | RANK IN GENE LIST | RANK METRIC SCORE | RUNNING ES | CORE ENRICHMENT | |
|---|---|---|---|---|---|---|---|---|
| 1 | NAPA | 1780537 5720102 | 1454 | 2.333 | -0.0318 | No | ||
| 2 | SNAP23 | 2480722 5390315 | 2641 | 1.097 | -0.0738 | No | ||
| 3 | COPZ1 | 6940100 | 2849 | 0.981 | -0.0653 | No | ||
| 4 | COPE | 2340088 2640450 6620279 | 3385 | 0.653 | -0.0811 | No | ||
| 5 | ERGIC3 | 1400075 4780047 | 3477 | 0.612 | -0.0738 | No | ||
| 6 | KIF1C | 2480484 | 4324 | 0.347 | -0.1124 | No | ||
| 7 | OPTN | 3940041 | 5236 | 0.210 | -0.1573 | No | ||
| 8 | AP3B2 | 4670605 | 6002 | 0.136 | -0.1957 | No | ||
| 9 | BET1 | 4010725 | 9932 | 0.016 | -0.4068 | No | ||
| 10 | COPB1 | 5390037 | 10505 | 0.007 | -0.4375 | No | ||
| 11 | EXOC5 | 7000711 | 10889 | 0.001 | -0.4581 | No | ||
| 12 | SEC22A | 3800162 3840168 5220164 5290632 | 10932 | -0.000 | -0.4603 | No | ||
| 13 | STX16 | 70315 | 12084 | -0.022 | -0.5218 | No | ||
| 14 | COG2 | 5900129 | 13508 | -0.071 | -0.5970 | No | ||
| 15 | SEC22B | 3190278 | 14046 | -0.113 | -0.6237 | No | ||
| 16 | LMAN1 | 3420068 | 15137 | -0.358 | -0.6752 | No | ||
| 17 | SEC22C | 1050600 6760050 | 15224 | -0.392 | -0.6720 | No | ||
| 18 | GOSR2 | 1850059 1980687 4590184 | 15683 | -0.626 | -0.6842 | No | ||
| 19 | COG7 | 360133 | 15814 | -0.695 | -0.6773 | No | ||
| 20 | STX18 | 4760706 | 16406 | -1.094 | -0.6873 | Yes | ||
| 21 | SCAMP3 | 2360707 | 16574 | -1.258 | -0.6713 | Yes | ||
| 22 | TXNDC1 | 520398 | 16588 | -1.271 | -0.6467 | Yes | ||
| 23 | COPG2 | 2370152 | 16968 | -1.700 | -0.6332 | Yes | ||
| 24 | SCAMP2 | 430114 | 17017 | -1.744 | -0.6010 | Yes | ||
| 25 | GOLGA5 | 6770301 | 17039 | -1.765 | -0.5670 | Yes | ||
| 26 | COPB2 | 610154 | 17247 | -2.026 | -0.5378 | Yes | ||
| 27 | COG3 | 3840746 | 17531 | -2.485 | -0.5035 | Yes | ||
| 28 | LMAN2L | 50079 6590100 6650338 | 17664 | -2.758 | -0.4557 | Yes | ||
| 29 | RAB14 | 6860139 | 17726 | -2.872 | -0.4018 | Yes | ||
| 30 | GOSR1 | 730279 | 17810 | -3.043 | -0.3456 | Yes | ||
| 31 | NRBP1 | 1740750 | 17879 | -3.217 | -0.2852 | Yes | ||
| 32 | RAB2A | 2450358 | 17896 | -3.248 | -0.2214 | Yes | ||
| 33 | STX7 | 5910484 | 18365 | -5.156 | -0.1438 | Yes | ||
| 34 | ZW10 | 2900735 3520687 | 18583 | -7.896 | 0.0018 | Yes |

