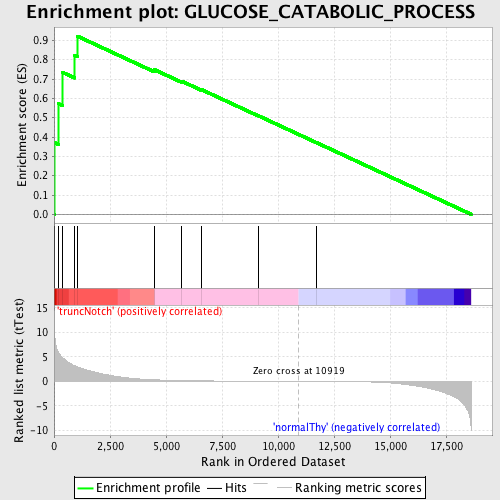
Profile of the Running ES Score & Positions of GeneSet Members on the Rank Ordered List
| Dataset | Set_03_truncNotch_versus_normalThy.phenotype_truncNotch_versus_normalThy.cls #truncNotch_versus_normalThy.phenotype_truncNotch_versus_normalThy.cls #truncNotch_versus_normalThy_repos |
| Phenotype | phenotype_truncNotch_versus_normalThy.cls#truncNotch_versus_normalThy_repos |
| Upregulated in class | truncNotch |
| GeneSet | GLUCOSE_CATABOLIC_PROCESS |
| Enrichment Score (ES) | 0.92181176 |
| Normalized Enrichment Score (NES) | 1.5676842 |
| Nominal p-value | 0.0 |
| FDR q-value | 0.14885017 |
| FWER p-Value | 0.952 |
| PROBE | DESCRIPTION (from dataset) | GENE SYMBOL | GENE_TITLE | RANK IN GENE LIST | RANK METRIC SCORE | RUNNING ES | CORE ENRICHMENT | |
|---|---|---|---|---|---|---|---|---|
| 1 | ALDOA | 6290672 | 14 | 10.281 | 0.3707 | Yes | ||
| 2 | PFKL | 6200167 | 205 | 5.841 | 0.5715 | Yes | ||
| 3 | PFKM | 1990156 5720168 | 383 | 4.761 | 0.7340 | Yes | ||
| 4 | PGLS | 2120324 | 922 | 3.187 | 0.8202 | Yes | ||
| 5 | PGD | 6840048 | 1033 | 2.976 | 0.9218 | Yes | ||
| 6 | GAPDHS | 2690463 | 4482 | 0.320 | 0.7481 | No | ||
| 7 | HK1 | 4280402 | 5684 | 0.164 | 0.6895 | No | ||
| 8 | PFKFB1 | 2370128 | 6572 | 0.105 | 0.6456 | No | ||
| 9 | TKTL1 | 2810672 6760102 | 9105 | 0.030 | 0.5106 | No | ||
| 10 | ALDOB | 4730324 | 11701 | -0.014 | 0.3716 | No |

