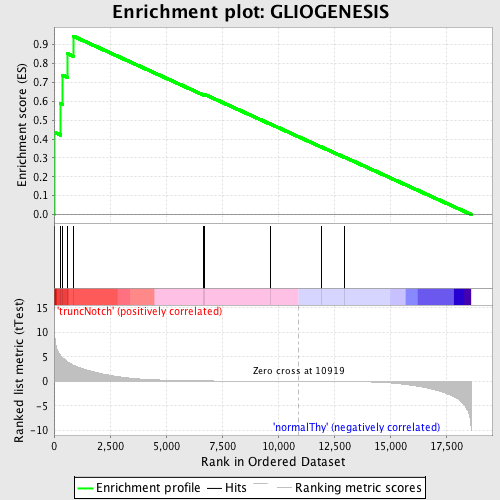
Profile of the Running ES Score & Positions of GeneSet Members on the Rank Ordered List
| Dataset | Set_03_truncNotch_versus_normalThy.phenotype_truncNotch_versus_normalThy.cls #truncNotch_versus_normalThy.phenotype_truncNotch_versus_normalThy.cls #truncNotch_versus_normalThy_repos |
| Phenotype | phenotype_truncNotch_versus_normalThy.cls#truncNotch_versus_normalThy_repos |
| Upregulated in class | truncNotch |
| GeneSet | GLIOGENESIS |
| Enrichment Score (ES) | 0.9454863 |
| Normalized Enrichment Score (NES) | 1.6133536 |
| Nominal p-value | 0.0 |
| FDR q-value | 0.1322317 |
| FWER p-Value | 0.721 |
| PROBE | DESCRIPTION (from dataset) | GENE SYMBOL | GENE_TITLE | RANK IN GENE LIST | RANK METRIC SCORE | RUNNING ES | CORE ENRICHMENT | |
|---|---|---|---|---|---|---|---|---|
| 1 | EIF2B5 | 430315 6900400 | 2 | 13.689 | 0.4363 | Yes | ||
| 2 | EIF2B3 | 3290463 | 289 | 5.263 | 0.5887 | Yes | ||
| 3 | EIF2B2 | 4290048 | 363 | 4.843 | 0.7392 | Yes | ||
| 4 | SOD1 | 5890070 | 612 | 3.959 | 0.8521 | Yes | ||
| 5 | EIF2B1 | 4610082 7040242 | 851 | 3.330 | 0.9455 | Yes | ||
| 6 | CDK6 | 4920253 | 6677 | 0.099 | 0.6356 | No | ||
| 7 | EIF2B4 | 5270082 | 6726 | 0.097 | 0.6361 | No | ||
| 8 | SLIT2 | 1940037 | 9637 | 0.021 | 0.4804 | No | ||
| 9 | NF2 | 4150735 6450139 | 11919 | -0.019 | 0.3584 | No | ||
| 10 | NF1 | 6980433 | 12956 | -0.046 | 0.3042 | No |

