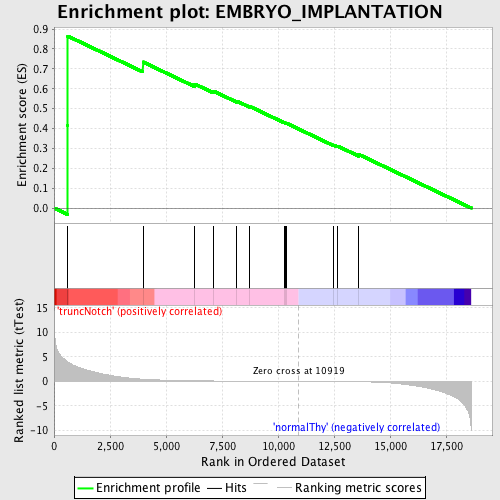
Profile of the Running ES Score & Positions of GeneSet Members on the Rank Ordered List
| Dataset | Set_03_truncNotch_versus_normalThy.phenotype_truncNotch_versus_normalThy.cls #truncNotch_versus_normalThy.phenotype_truncNotch_versus_normalThy.cls #truncNotch_versus_normalThy_repos |
| Phenotype | phenotype_truncNotch_versus_normalThy.cls#truncNotch_versus_normalThy_repos |
| Upregulated in class | truncNotch |
| GeneSet | EMBRYO_IMPLANTATION |
| Enrichment Score (ES) | 0.86454666 |
| Normalized Enrichment Score (NES) | 1.5916159 |
| Nominal p-value | 0.005586592 |
| FDR q-value | 0.15162778 |
| FWER p-Value | 0.869 |
| PROBE | DESCRIPTION (from dataset) | GENE SYMBOL | GENE_TITLE | RANK IN GENE LIST | RANK METRIC SCORE | RUNNING ES | CORE ENRICHMENT | |
|---|---|---|---|---|---|---|---|---|
| 1 | RPL29 | 1240075 | 604 | 3.977 | 0.4172 | Yes | ||
| 2 | SOD1 | 5890070 | 612 | 3.959 | 0.8645 | Yes | ||
| 3 | SCGB1A1 | 2970044 | 3968 | 0.444 | 0.7345 | No | ||
| 4 | SPRR2G | 6550519 | 6279 | 0.119 | 0.6237 | No | ||
| 5 | PRLR | 1980647 1990097 | 7115 | 0.081 | 0.5880 | No | ||
| 6 | SPRR2A | 360632 | 8156 | 0.050 | 0.5378 | No | ||
| 7 | SFRP4 | 3190685 | 8727 | 0.038 | 0.5114 | No | ||
| 8 | PPARD | 110131 | 10281 | 0.011 | 0.4292 | No | ||
| 9 | SPRR2D | 1340458 | 10348 | 0.010 | 0.4267 | No | ||
| 10 | SPRR2E | 6620100 | 10365 | 0.009 | 0.4269 | No | ||
| 11 | SPRR2B | 60037 | 12483 | -0.032 | 0.3167 | No | ||
| 12 | SPRR2F | 670551 | 12665 | -0.036 | 0.3111 | No | ||
| 13 | TRO | 1980113 | 13606 | -0.077 | 0.2693 | No |

