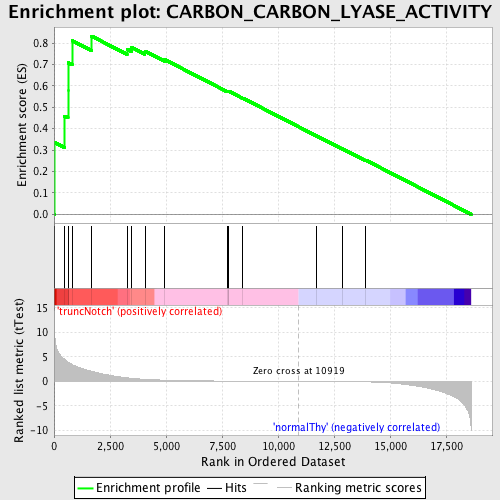
Profile of the Running ES Score & Positions of GeneSet Members on the Rank Ordered List
| Dataset | Set_03_truncNotch_versus_normalThy.phenotype_truncNotch_versus_normalThy.cls #truncNotch_versus_normalThy.phenotype_truncNotch_versus_normalThy.cls #truncNotch_versus_normalThy_repos |
| Phenotype | phenotype_truncNotch_versus_normalThy.cls#truncNotch_versus_normalThy_repos |
| Upregulated in class | truncNotch |
| GeneSet | CARBON_CARBON_LYASE_ACTIVITY |
| Enrichment Score (ES) | 0.8323118 |
| Normalized Enrichment Score (NES) | 1.5823141 |
| Nominal p-value | 0.008665511 |
| FDR q-value | 0.1452872 |
| FWER p-Value | 0.909 |
| PROBE | DESCRIPTION (from dataset) | GENE SYMBOL | GENE_TITLE | RANK IN GENE LIST | RANK METRIC SCORE | RUNNING ES | CORE ENRICHMENT | |
|---|---|---|---|---|---|---|---|---|
| 1 | ALDOA | 6290672 | 14 | 10.281 | 0.3364 | Yes | ||
| 2 | DDC | 670408 | 470 | 4.468 | 0.4584 | Yes | ||
| 3 | UMPS | 2340541 4730438 | 621 | 3.938 | 0.5795 | Yes | ||
| 4 | MLYCD | 6760181 | 623 | 3.935 | 0.7084 | Yes | ||
| 5 | MVD | 2060717 | 806 | 3.437 | 0.8114 | Yes | ||
| 6 | BCKDHA | 50189 | 1670 | 2.054 | 0.8323 | Yes | ||
| 7 | BCKDHB | 780372 | 3257 | 0.718 | 0.7706 | No | ||
| 8 | GGCX | 770377 3990441 | 3458 | 0.619 | 0.7801 | No | ||
| 9 | UROD | 2470494 | 4057 | 0.417 | 0.7617 | No | ||
| 10 | GAD1 | 2360035 3140167 | 4919 | 0.249 | 0.7235 | No | ||
| 11 | PCK1 | 7000358 | 7734 | 0.061 | 0.5742 | No | ||
| 12 | AMD1 | 6290128 | 7786 | 0.060 | 0.5735 | No | ||
| 13 | ODC1 | 5670168 | 7800 | 0.059 | 0.5747 | No | ||
| 14 | ACMSD | 1450538 | 8427 | 0.044 | 0.5425 | No | ||
| 15 | ALDOB | 4730324 | 11701 | -0.014 | 0.3670 | No | ||
| 16 | HDC | 4150463 | 12869 | -0.043 | 0.3057 | No | ||
| 17 | ALDOC | 450121 610427 | 13912 | -0.100 | 0.2529 | No |

