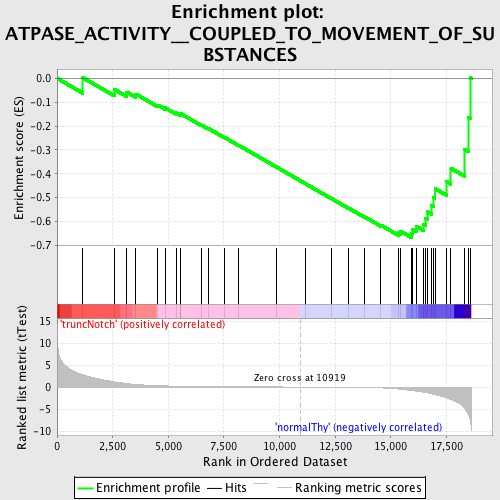
Profile of the Running ES Score & Positions of GeneSet Members on the Rank Ordered List
| Dataset | Set_03_truncNotch_versus_normalThy.phenotype_truncNotch_versus_normalThy.cls #truncNotch_versus_normalThy.phenotype_truncNotch_versus_normalThy.cls #truncNotch_versus_normalThy_repos |
| Phenotype | phenotype_truncNotch_versus_normalThy.cls#truncNotch_versus_normalThy_repos |
| Upregulated in class | normalThy |
| GeneSet | ATPASE_ACTIVITY__COUPLED_TO_MOVEMENT_OF_SUBSTANCES |
| Enrichment Score (ES) | -0.6669334 |
| Normalized Enrichment Score (NES) | -1.5462643 |
| Nominal p-value | 0.019512195 |
| FDR q-value | 0.48332453 |
| FWER p-Value | 0.995 |
| PROBE | DESCRIPTION (from dataset) | GENE SYMBOL | GENE_TITLE | RANK IN GENE LIST | RANK METRIC SCORE | RUNNING ES | CORE ENRICHMENT | |
|---|---|---|---|---|---|---|---|---|
| 1 | ABCF1 | 2630707 2760273 3520725 | 1159 | 2.767 | 0.0024 | No | ||
| 2 | ABCD4 | 1450164 | 2567 | 1.152 | -0.0463 | No | ||
| 3 | ABCB7 | 4150324 | 3130 | 0.794 | -0.0579 | No | ||
| 4 | TAPBP | 1980110 | 3539 | 0.586 | -0.0661 | No | ||
| 5 | ABCC2 | 380202 5390300 | 4531 | 0.311 | -0.1122 | No | ||
| 6 | ABCC3 | 4050242 | 4855 | 0.257 | -0.1235 | No | ||
| 7 | ABCC1 | 4760722 6770280 | 5343 | 0.199 | -0.1451 | No | ||
| 8 | ATP7A | 6550168 | 5556 | 0.175 | -0.1524 | No | ||
| 9 | ATP1A3 | 5690674 | 5564 | 0.175 | -0.1486 | No | ||
| 10 | ATP1A2 | 110278 | 6494 | 0.109 | -0.1961 | No | ||
| 11 | ATP6V0C | 1780609 | 6801 | 0.094 | -0.2104 | No | ||
| 12 | ATP4B | 1740156 | 7535 | 0.067 | -0.2482 | No | ||
| 13 | ABCG2 | 6370056 | 8160 | 0.050 | -0.2807 | No | ||
| 14 | ATP2A3 | 130440 2190451 | 9873 | 0.017 | -0.3724 | No | ||
| 15 | ABCC6 | 6900168 | 11156 | -0.004 | -0.4413 | No | ||
| 16 | ATP7B | 2060711 2470039 3140301 6650735 | 12323 | -0.027 | -0.5034 | No | ||
| 17 | ATP2B3 | 2260022 3780059 | 13107 | -0.052 | -0.5443 | No | ||
| 18 | ATP4A | 6220154 | 13804 | -0.092 | -0.5796 | No | ||
| 19 | ABCB11 | 7040170 | 14549 | -0.189 | -0.6153 | No | ||
| 20 | ATP2A1 | 110309 | 15347 | -0.444 | -0.6477 | No | ||
| 21 | ATP2C1 | 2630446 6520253 | 15447 | -0.500 | -0.6414 | No | ||
| 22 | ATP1B2 | 4480603 | 15923 | -0.763 | -0.6491 | Yes | ||
| 23 | FXYD2 | 1400280 2350719 3520184 7040377 | 15990 | -0.804 | -0.6338 | Yes | ||
| 24 | ATP11B | 4230100 | 16157 | -0.935 | -0.6208 | Yes | ||
| 25 | ATP2A2 | 1090075 3990279 | 16474 | -1.160 | -0.6106 | Yes | ||
| 26 | ATP6V0E1 | 6760053 | 16571 | -1.255 | -0.5864 | Yes | ||
| 27 | ABCA3 | 7000746 | 16645 | -1.329 | -0.5592 | Yes | ||
| 28 | ATP6V1C1 | 2690324 5220528 | 16830 | -1.548 | -0.5328 | Yes | ||
| 29 | ATP1B3 | 6040128 | 16913 | -1.649 | -0.4986 | Yes | ||
| 30 | ABCD3 | 7040341 | 16985 | -1.714 | -0.4623 | Yes | ||
| 31 | RALBP1 | 4780632 | 17514 | -2.449 | -0.4333 | Yes | ||
| 32 | ATP1A1 | 5670451 | 17702 | -2.827 | -0.3772 | Yes | ||
| 33 | ATP6V1B2 | 4060528 | 18306 | -4.804 | -0.2970 | Yes | ||
| 34 | ATP1B1 | 3130594 | 18480 | -6.052 | -0.1646 | Yes | ||
| 35 | ABCG1 | 60692 | 18562 | -7.335 | 0.0029 | Yes |

