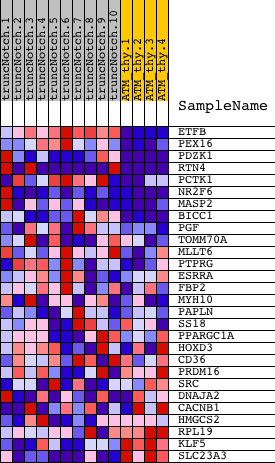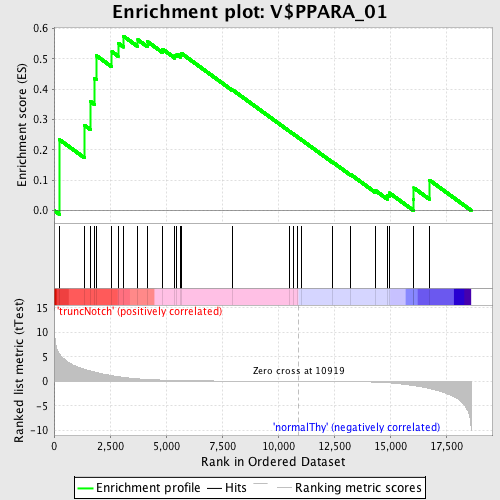
Profile of the Running ES Score & Positions of GeneSet Members on the Rank Ordered List
| Dataset | Set_03_truncNotch_versus_normalThy.phenotype_truncNotch_versus_normalThy.cls #truncNotch_versus_normalThy.phenotype_truncNotch_versus_normalThy.cls #truncNotch_versus_normalThy_repos |
| Phenotype | phenotype_truncNotch_versus_normalThy.cls#truncNotch_versus_normalThy_repos |
| Upregulated in class | truncNotch |
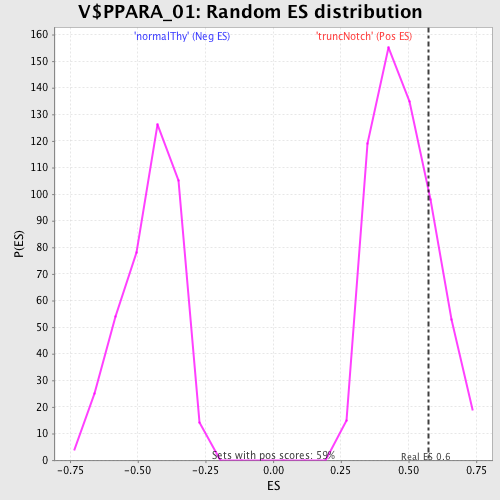
| GeneSet | V$PPARA_01 |
| Enrichment Score (ES) | 0.5745687 |
| Normalized Enrichment Score (NES) | 1.2001864 |
| Nominal p-value | 0.2053872 |
| FDR q-value | 1.0 |
| FWER p-Value | 1.0 |
| PROBE | DESCRIPTION (from dataset) | GENE SYMBOL | GENE_TITLE | RANK IN GENE LIST | RANK METRIC SCORE | RUNNING ES | CORE ENRICHMENT | |
|---|---|---|---|---|---|---|---|---|
| 1 | ETFB | 2690025 | 247 | 5.606 | 0.2329 | Yes | ||
| 2 | PEX16 | 4560044 | 1355 | 2.449 | 0.2809 | Yes | ||
| 3 | PDZK1 | 2320128 | 1625 | 2.106 | 0.3589 | Yes | ||
| 4 | RTN4 | 50725 630647 870097 870184 | 1799 | 1.934 | 0.4345 | Yes | ||
| 5 | PCTK1 | 4560079 | 1885 | 1.833 | 0.5104 | Yes | ||
| 6 | NR2F6 | 1340239 5670239 60338 4280088 | 2582 | 1.143 | 0.5232 | Yes | ||
| 7 | MASP2 | 360110 | 2857 | 0.974 | 0.5512 | Yes | ||
| 8 | BICC1 | 4670647 | 3093 | 0.820 | 0.5746 | Yes | ||
| 9 | PGF | 4810593 | 3740 | 0.512 | 0.5623 | No | ||
| 10 | TOMM70A | 780114 | 4161 | 0.390 | 0.5568 | No | ||
| 11 | MLLT6 | 3870168 | 4839 | 0.260 | 0.5318 | No | ||
| 12 | PTPRG | 2650524 1340022 | 5393 | 0.194 | 0.5106 | No | ||
| 13 | ESRRA | 6550242 | 5482 | 0.182 | 0.5138 | No | ||
| 14 | FBP2 | 1580193 | 5642 | 0.169 | 0.5127 | No | ||
| 15 | MYH10 | 2640673 | 5697 | 0.163 | 0.5170 | No | ||
| 16 | PAPLN | 2510592 | 7971 | 0.055 | 0.3971 | No | ||
| 17 | SS18 | 1940440 2900072 6900129 | 10506 | 0.007 | 0.2611 | No | ||
| 18 | PPARGC1A | 4670040 | 10672 | 0.004 | 0.2524 | No | ||
| 19 | HOXD3 | 6450154 | 10852 | 0.001 | 0.2428 | No | ||
| 20 | CD36 | 5890575 | 11024 | -0.002 | 0.2337 | No | ||
| 21 | PRDM16 | 4120541 | 12423 | -0.030 | 0.1598 | No | ||
| 22 | SRC | 580132 | 13241 | -0.057 | 0.1184 | No | ||
| 23 | DNAJA2 | 2630253 6860358 | 14334 | -0.149 | 0.0662 | No | ||
| 24 | CACNB1 | 2940427 3710487 | 14880 | -0.278 | 0.0491 | No | ||
| 25 | HMGCS2 | 770725 | 14967 | -0.302 | 0.0577 | No | ||
| 26 | RPL19 | 5550592 | 16041 | -0.846 | 0.0372 | No | ||
| 27 | KLF5 | 3840348 | 16062 | -0.866 | 0.0741 | No | ||
| 28 | SLC23A3 | 6840152 | 16754 | -1.439 | 0.1002 | No |