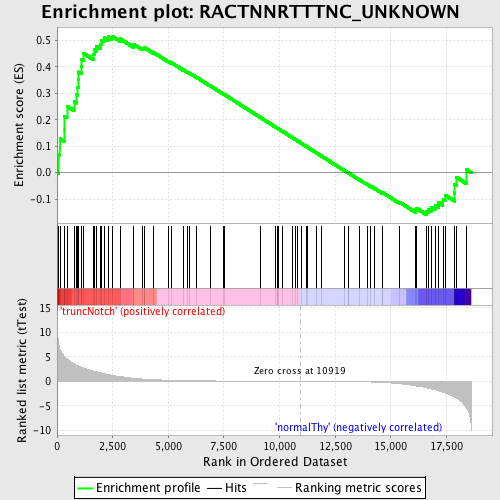
Profile of the Running ES Score & Positions of GeneSet Members on the Rank Ordered List
| Dataset | Set_03_truncNotch_versus_normalThy.phenotype_truncNotch_versus_normalThy.cls #truncNotch_versus_normalThy.phenotype_truncNotch_versus_normalThy.cls #truncNotch_versus_normalThy_repos |
| Phenotype | phenotype_truncNotch_versus_normalThy.cls#truncNotch_versus_normalThy_repos |
| Upregulated in class | truncNotch |
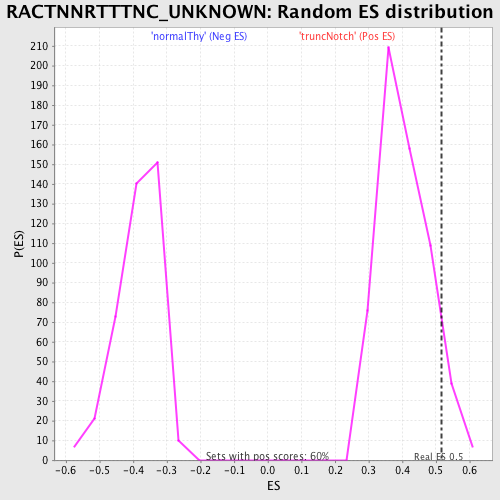
| GeneSet | RACTNNRTTTNC_UNKNOWN |
| Enrichment Score (ES) | 0.5168761 |
| Normalized Enrichment Score (NES) | 1.2738782 |
| Nominal p-value | 0.07190636 |
| FDR q-value | 1.0 |
| FWER p-Value | 1.0 |
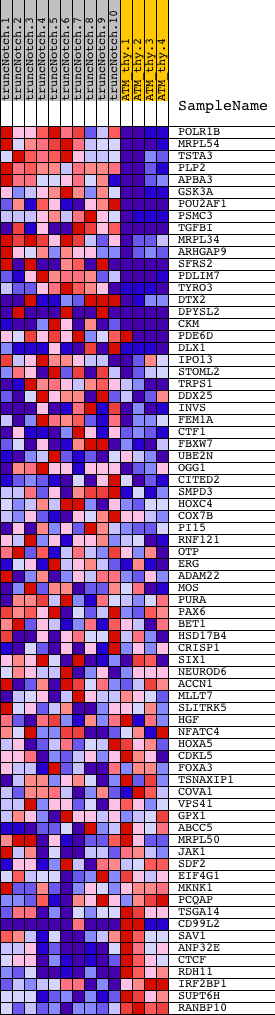
| PROBE | DESCRIPTION (from dataset) | GENE SYMBOL | GENE_TITLE | RANK IN GENE LIST | RANK METRIC SCORE | RUNNING ES | CORE ENRICHMENT | |
|---|---|---|---|---|---|---|---|---|
| 1 | POLR1B | 510315 | 76 | 7.349 | 0.0670 | Yes | ||
| 2 | MRPL54 | 870403 | 129 | 6.599 | 0.1280 | Yes | ||
| 3 | TSTA3 | 1230100 | 335 | 4.993 | 0.1652 | Yes | ||
| 4 | PLP2 | 2100167 | 337 | 4.972 | 0.2132 | Yes | ||
| 5 | APBA3 | 2510348 | 446 | 4.563 | 0.2515 | Yes | ||
| 6 | GSK3A | 3140735 | 762 | 3.573 | 0.2691 | Yes | ||
| 7 | POU2AF1 | 5690242 | 865 | 3.303 | 0.2955 | Yes | ||
| 8 | PSMC3 | 2480184 | 911 | 3.206 | 0.3241 | Yes | ||
| 9 | TGFBI | 2060446 6900112 | 947 | 3.135 | 0.3525 | Yes | ||
| 10 | MRPL34 | 3520605 | 971 | 3.086 | 0.3811 | Yes | ||
| 11 | ARHGAP9 | 2230301 | 1088 | 2.895 | 0.4028 | Yes | ||
| 12 | SFRS2 | 50707 380593 | 1104 | 2.865 | 0.4297 | Yes | ||
| 13 | PDLIM7 | 4780136 | 1190 | 2.726 | 0.4515 | Yes | ||
| 14 | TYRO3 | 3130193 | 1623 | 2.108 | 0.4486 | Yes | ||
| 15 | DTX2 | 4210041 7000008 | 1666 | 2.058 | 0.4662 | Yes | ||
| 16 | DPYSL2 | 2100427 3130112 5700324 | 1778 | 1.951 | 0.4791 | Yes | ||
| 17 | CKM | 1450524 | 1965 | 1.756 | 0.4861 | Yes | ||
| 18 | PDE6D | 3130537 3390014 | 1980 | 1.740 | 0.5021 | Yes | ||
| 19 | DLX1 | 360168 | 2111 | 1.576 | 0.5103 | Yes | ||
| 20 | IPO13 | 3870088 | 2301 | 1.411 | 0.5138 | Yes | ||
| 21 | STOML2 | 1940487 | 2467 | 1.239 | 0.5169 | Yes | ||
| 22 | TRPS1 | 870100 | 2834 | 0.988 | 0.5067 | No | ||
| 23 | DDX25 | 5910121 | 3443 | 0.626 | 0.4800 | No | ||
| 24 | INVS | 4200632 6620528 | 3449 | 0.624 | 0.4857 | No | ||
| 25 | FEM1A | 6520091 | 3828 | 0.481 | 0.4700 | No | ||
| 26 | CTF1 | 2060025 | 3931 | 0.453 | 0.4689 | No | ||
| 27 | FBXW7 | 4210338 7050280 | 3939 | 0.452 | 0.4729 | No | ||
| 28 | UBE2N | 520369 2900047 | 4340 | 0.345 | 0.4546 | No | ||
| 29 | OGG1 | 1940279 | 5007 | 0.238 | 0.4210 | No | ||
| 30 | CITED2 | 5670114 5130088 | 5122 | 0.223 | 0.4170 | No | ||
| 31 | SMPD3 | 520164 | 5674 | 0.166 | 0.3889 | No | ||
| 32 | HOXC4 | 1940193 | 5877 | 0.146 | 0.3794 | No | ||
| 33 | COX7B | 2340504 | 5943 | 0.141 | 0.3773 | No | ||
| 34 | PI15 | 3840133 | 6254 | 0.120 | 0.3617 | No | ||
| 35 | RNF121 | 110079 1580279 | 6916 | 0.089 | 0.3270 | No | ||
| 36 | OTP | 2630070 | 7484 | 0.068 | 0.2970 | No | ||
| 37 | ERG | 50154 1770739 | 7539 | 0.066 | 0.2948 | No | ||
| 38 | ADAM22 | 5390368 | 9125 | 0.030 | 0.2096 | No | ||
| 39 | MOS | 5290619 | 9826 | 0.018 | 0.1720 | No | ||
| 40 | PURA | 3870156 | 9894 | 0.017 | 0.1685 | No | ||
| 41 | PAX6 | 1190025 | 9897 | 0.017 | 0.1686 | No | ||
| 42 | BET1 | 4010725 | 9932 | 0.016 | 0.1669 | No | ||
| 43 | HSD17B4 | 4780504 | 10149 | 0.013 | 0.1554 | No | ||
| 44 | CRISP1 | 50181 | 10595 | 0.006 | 0.1315 | No | ||
| 45 | SIX1 | 6760471 | 10693 | 0.004 | 0.1263 | No | ||
| 46 | NEUROD6 | 4670731 | 10794 | 0.002 | 0.1209 | No | ||
| 47 | ACCN1 | 2060139 2190541 | 10975 | -0.001 | 0.1112 | No | ||
| 48 | MLLT7 | 4480707 | 11196 | -0.005 | 0.0994 | No | ||
| 49 | SLITRK5 | 6590292 | 11244 | -0.005 | 0.0969 | No | ||
| 50 | HGF | 3360593 | 11644 | -0.013 | 0.0755 | No | ||
| 51 | NFATC4 | 2470735 | 11895 | -0.018 | 0.0622 | No | ||
| 52 | HOXA5 | 6840026 | 12931 | -0.045 | 0.0068 | No | ||
| 53 | CDKL5 | 2450070 | 13087 | -0.051 | -0.0011 | No | ||
| 54 | FOXA3 | 2680121 | 13096 | -0.051 | -0.0010 | No | ||
| 55 | TSNAXIP1 | 1770270 6180577 | 13609 | -0.077 | -0.0279 | No | ||
| 56 | COVA1 | 5340504 5360594 | 13945 | -0.103 | -0.0449 | No | ||
| 57 | VPS41 | 770056 4730471 | 14103 | -0.118 | -0.0523 | No | ||
| 58 | GPX1 | 4150093 | 14283 | -0.141 | -0.0605 | No | ||
| 59 | ABCC5 | 2100600 5050692 | 14616 | -0.203 | -0.0765 | No | ||
| 60 | MRPL50 | 1740465 | 14617 | -0.203 | -0.0745 | No | ||
| 61 | JAK1 | 5910746 | 15409 | -0.481 | -0.1125 | No | ||
| 62 | SDF2 | 2690601 | 16102 | -0.899 | -0.1411 | No | ||
| 63 | EIF4G1 | 4070446 | 16163 | -0.938 | -0.1353 | No | ||
| 64 | MKNK1 | 6510161 | 16592 | -1.273 | -0.1461 | No | ||
| 65 | PCQAP | 3060064 6200273 | 16689 | -1.362 | -0.1381 | No | ||
| 66 | TSGA14 | 6660465 | 16832 | -1.548 | -0.1308 | No | ||
| 67 | CD99L2 | 360592 5420497 | 16988 | -1.715 | -0.1226 | No | ||
| 68 | SAV1 | 5420541 | 17146 | -1.900 | -0.1126 | No | ||
| 69 | ANP32E | 6510706 | 17345 | -2.180 | -0.1023 | No | ||
| 70 | CTCF | 5340017 | 17438 | -2.325 | -0.0847 | No | ||
| 71 | RDH11 | 4810673 | 17868 | -3.194 | -0.0770 | No | ||
| 72 | IRF2BP1 | 3170019 | 17877 | -3.214 | -0.0463 | No | ||
| 73 | SUPT6H | 3170082 | 17951 | -3.391 | -0.0175 | No | ||
| 74 | RANBP10 | 2340184 | 18412 | -5.513 | 0.0110 | No |