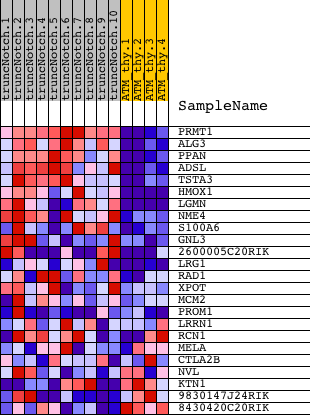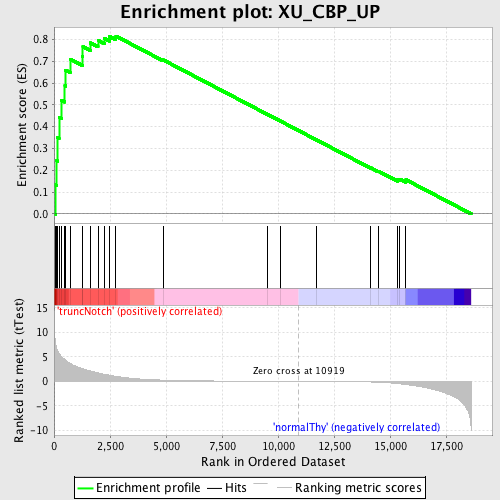
Profile of the Running ES Score & Positions of GeneSet Members on the Rank Ordered List
| Dataset | Set_03_truncNotch_versus_normalThy.phenotype_truncNotch_versus_normalThy.cls #truncNotch_versus_normalThy.phenotype_truncNotch_versus_normalThy.cls #truncNotch_versus_normalThy_repos |
| Phenotype | phenotype_truncNotch_versus_normalThy.cls#truncNotch_versus_normalThy_repos |
| Upregulated in class | truncNotch |
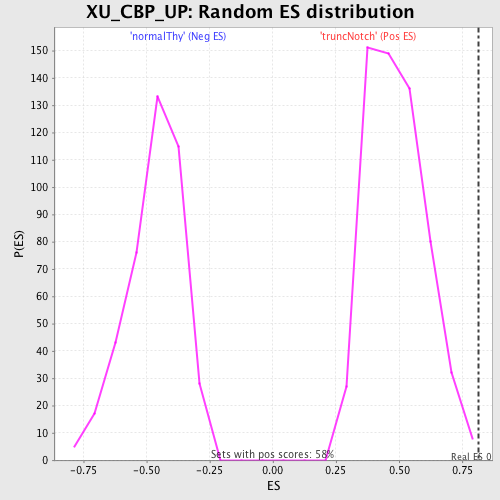
| GeneSet | XU_CBP_UP |
| Enrichment Score (ES) | 0.81559175 |
| Normalized Enrichment Score (NES) | 1.6637983 |
| Nominal p-value | 0.0017152659 |
| FDR q-value | 0.035604116 |
| FWER p-Value | 0.486 |
| PROBE | DESCRIPTION (from dataset) | GENE SYMBOL | GENE_TITLE | RANK IN GENE LIST | RANK METRIC SCORE | RUNNING ES | CORE ENRICHMENT | |
|---|---|---|---|---|---|---|---|---|
| 1 | PRMT1 | 2850050 | 52 | 8.110 | 0.1341 | Yes | ||
| 2 | ALG3 | 2650647 7100131 | 119 | 6.678 | 0.2433 | Yes | ||
| 3 | PPAN | 540398 | 146 | 6.412 | 0.3502 | Yes | ||
| 4 | ADSL | 5570484 | 223 | 5.722 | 0.4427 | Yes | ||
| 5 | TSTA3 | 1230100 | 335 | 4.993 | 0.5211 | Yes | ||
| 6 | HMOX1 | 1740687 | 484 | 4.425 | 0.5878 | Yes | ||
| 7 | LGMN | 3610301 | 516 | 4.308 | 0.6589 | Yes | ||
| 8 | NME4 | 3140736 5900446 | 717 | 3.684 | 0.7103 | Yes | ||
| 9 | S100A6 | 1690204 | 1271 | 2.586 | 0.7243 | Yes | ||
| 10 | GNL3 | 4050338 4810500 | 1287 | 2.554 | 0.7666 | Yes | ||
| 11 | 2600005C20RIK | 1090746 5220242 | 1619 | 2.110 | 0.7844 | Yes | ||
| 12 | LRG1 | 5690605 | 1961 | 1.758 | 0.7958 | Yes | ||
| 13 | RAD1 | 4200551 | 2246 | 1.460 | 0.8051 | Yes | ||
| 14 | XPOT | 7050184 | 2477 | 1.223 | 0.8134 | Yes | ||
| 15 | MCM2 | 5050139 | 2758 | 1.020 | 0.8156 | Yes | ||
| 16 | PROM1 | 3170537 | 4872 | 0.256 | 0.7063 | No | ||
| 17 | LRRN1 | 3290154 | 9525 | 0.023 | 0.4565 | No | ||
| 18 | RCN1 | 2480041 | 10116 | 0.014 | 0.4250 | No | ||
| 19 | MELA | 2340438 3450717 | 11732 | -0.015 | 0.3384 | No | ||
| 20 | CTLA2B | 4210168 | 14135 | -0.121 | 0.2112 | No | ||
| 21 | NVL | 2690687 6900735 | 14476 | -0.174 | 0.1959 | No | ||
| 22 | KTN1 | 70446 3450609 4560048 | 15340 | -0.439 | 0.1569 | No | ||
| 23 | 9830147J24RIK | 2690451 | 15438 | -0.495 | 0.1600 | No | ||
| 24 | 8430420C20RIK | 6110465 | 15706 | -0.643 | 0.1565 | No |