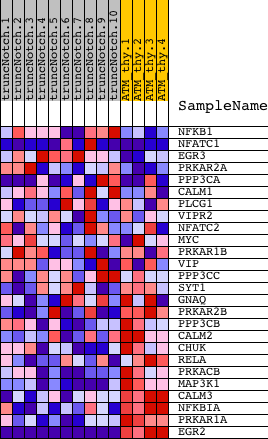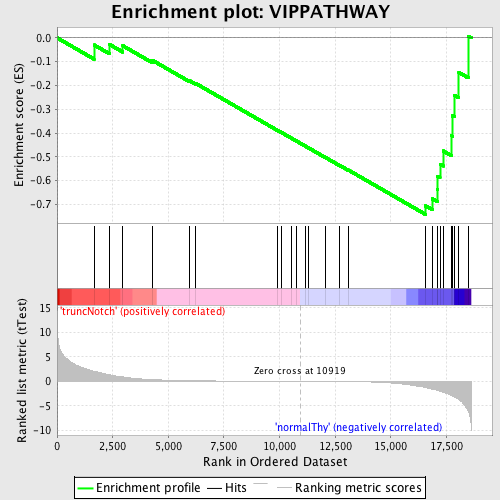
Profile of the Running ES Score & Positions of GeneSet Members on the Rank Ordered List
| Dataset | Set_03_truncNotch_versus_normalThy.phenotype_truncNotch_versus_normalThy.cls #truncNotch_versus_normalThy.phenotype_truncNotch_versus_normalThy.cls #truncNotch_versus_normalThy_repos |
| Phenotype | phenotype_truncNotch_versus_normalThy.cls#truncNotch_versus_normalThy_repos |
| Upregulated in class | normalThy |
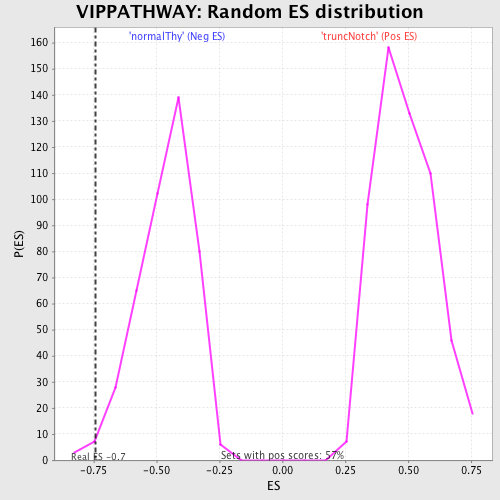
| GeneSet | VIPPATHWAY |
| Enrichment Score (ES) | -0.742093 |
| Normalized Enrichment Score (NES) | -1.6043358 |
| Nominal p-value | 0.013953488 |
| FDR q-value | 0.31869945 |
| FWER p-Value | 0.965 |
| PROBE | DESCRIPTION (from dataset) | GENE SYMBOL | GENE_TITLE | RANK IN GENE LIST | RANK METRIC SCORE | RUNNING ES | CORE ENRICHMENT | |
|---|---|---|---|---|---|---|---|---|
| 1 | NFKB1 | 5420358 | 1663 | 2.059 | -0.0298 | No | ||
| 2 | NFATC1 | 510400 2320348 4050600 6180161 6290136 6620086 | 2365 | 1.357 | -0.0282 | No | ||
| 3 | EGR3 | 6940128 | 2953 | 0.918 | -0.0332 | No | ||
| 4 | PRKAR2A | 2340136 | 4297 | 0.355 | -0.0952 | No | ||
| 5 | PPP3CA | 4760332 6760092 | 5932 | 0.142 | -0.1789 | No | ||
| 6 | CALM1 | 380128 | 6240 | 0.121 | -0.1919 | No | ||
| 7 | PLCG1 | 6020369 | 9889 | 0.017 | -0.3877 | No | ||
| 8 | VIPR2 | 6520050 | 10082 | 0.014 | -0.3976 | No | ||
| 9 | NFATC2 | 70450 540097 | 10515 | 0.007 | -0.4206 | No | ||
| 10 | MYC | 380541 4670170 | 10764 | 0.003 | -0.4339 | No | ||
| 11 | PRKAR1B | 6130411 | 11145 | -0.004 | -0.4542 | No | ||
| 12 | VIP | 2850647 | 11302 | -0.006 | -0.4624 | No | ||
| 13 | PPP3CC | 2450139 | 12057 | -0.021 | -0.5024 | No | ||
| 14 | SYT1 | 840364 | 12704 | -0.038 | -0.5360 | No | ||
| 15 | GNAQ | 430670 4210131 5900736 | 13086 | -0.051 | -0.5551 | No | ||
| 16 | PRKAR2B | 3130593 5220577 | 16564 | -1.246 | -0.7060 | Yes | ||
| 17 | PPP3CB | 6020156 | 16865 | -1.582 | -0.6763 | Yes | ||
| 18 | CALM2 | 6620463 | 17088 | -1.826 | -0.6354 | Yes | ||
| 19 | CHUK | 7050736 | 17108 | -1.856 | -0.5826 | Yes | ||
| 20 | RELA | 3830075 | 17212 | -1.973 | -0.5310 | Yes | ||
| 21 | PRKACB | 4210170 | 17353 | -2.193 | -0.4750 | Yes | ||
| 22 | MAP3K1 | 5360347 | 17735 | -2.897 | -0.4116 | Yes | ||
| 23 | CALM3 | 3390288 | 17770 | -2.963 | -0.3276 | Yes | ||
| 24 | NFKBIA | 1570152 | 17856 | -3.162 | -0.2406 | Yes | ||
| 25 | PRKAR1A | 3450369 | 18057 | -3.664 | -0.1453 | Yes | ||
| 26 | EGR2 | 3800403 | 18481 | -6.052 | 0.0073 | Yes |