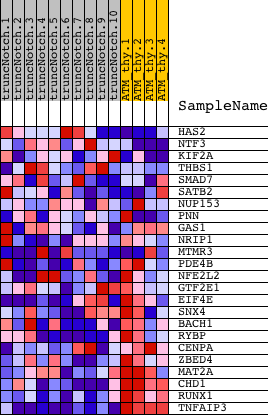
Profile of the Running ES Score & Positions of GeneSet Members on the Rank Ordered List
| Dataset | Set_03_truncNotch_versus_normalThy.phenotype_truncNotch_versus_normalThy.cls #truncNotch_versus_normalThy.phenotype_truncNotch_versus_normalThy.cls #truncNotch_versus_normalThy_repos |
| Phenotype | phenotype_truncNotch_versus_normalThy.cls#truncNotch_versus_normalThy_repos |
| Upregulated in class | normalThy |
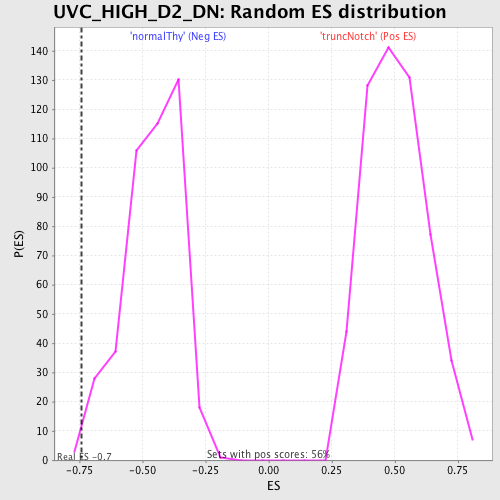
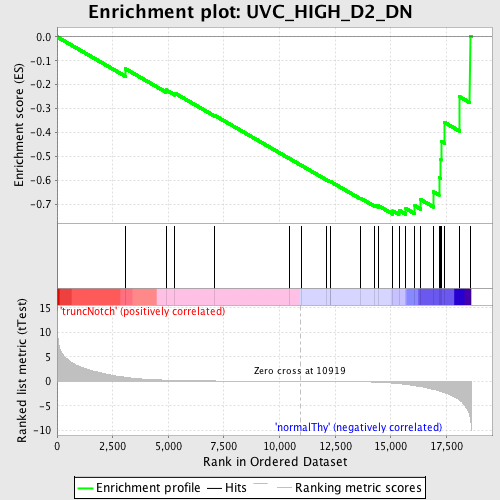
| GeneSet | UVC_HIGH_D2_DN |
| Enrichment Score (ES) | -0.7423575 |
| Normalized Enrichment Score (NES) | -1.6109293 |
| Nominal p-value | 0.006849315 |
| FDR q-value | 0.3453356 |
| FWER p-Value | 0.947 |
| PROBE | DESCRIPTION (from dataset) | GENE SYMBOL | GENE_TITLE | RANK IN GENE LIST | RANK METRIC SCORE | RUNNING ES | CORE ENRICHMENT | |
|---|---|---|---|---|---|---|---|---|
| 1 | HAS2 | 5360181 | 3068 | 0.836 | -0.1331 | No | ||
| 2 | NTF3 | 5890131 | 4896 | 0.251 | -0.2217 | No | ||
| 3 | KIF2A | 3990286 6130575 | 5296 | 0.204 | -0.2354 | No | ||
| 4 | THBS1 | 4560494 430288 | 7087 | 0.082 | -0.3286 | No | ||
| 5 | SMAD7 | 430377 | 10452 | 0.008 | -0.5092 | No | ||
| 6 | SATB2 | 2470181 | 10987 | -0.001 | -0.5378 | No | ||
| 7 | NUP153 | 7000452 | 12122 | -0.023 | -0.5980 | No | ||
| 8 | PNN | 6650504 | 12267 | -0.026 | -0.6047 | No | ||
| 9 | GAS1 | 2120504 | 12274 | -0.026 | -0.6040 | No | ||
| 10 | NRIP1 | 3190039 | 13633 | -0.079 | -0.6741 | No | ||
| 11 | MTMR3 | 1050014 4920180 | 14277 | -0.140 | -0.7033 | No | ||
| 12 | PDE4B | 4480121 | 14432 | -0.166 | -0.7052 | No | ||
| 13 | NFE2L2 | 2810619 3390162 | 15094 | -0.343 | -0.7277 | Yes | ||
| 14 | GTF2E1 | 4070014 | 15368 | -0.458 | -0.7249 | Yes | ||
| 15 | EIF4E | 1580403 70133 6380215 | 15675 | -0.622 | -0.7176 | Yes | ||
| 16 | SNX4 | 1980358 | 16079 | -0.877 | -0.7057 | Yes | ||
| 17 | BACH1 | 290195 | 16344 | -1.040 | -0.6802 | Yes | ||
| 18 | RYBP | 60746 | 16923 | -1.658 | -0.6480 | Yes | ||
| 19 | CENPA | 5080154 | 17168 | -1.922 | -0.5877 | Yes | ||
| 20 | ZBED4 | 770441 | 17250 | -2.035 | -0.5143 | Yes | ||
| 21 | MAT2A | 4070026 4730079 6020280 | 17258 | -2.048 | -0.4364 | Yes | ||
| 22 | CHD1 | 4590048 | 17402 | -2.277 | -0.3571 | Yes | ||
| 23 | RUNX1 | 3840711 | 18089 | -3.768 | -0.2501 | Yes | ||
| 24 | TNFAIP3 | 2900142 | 18558 | -7.288 | 0.0031 | Yes |