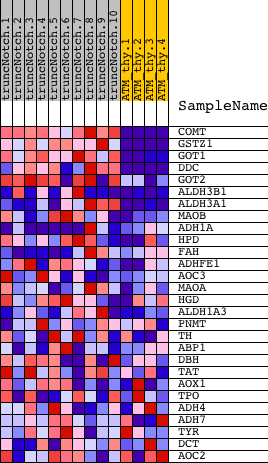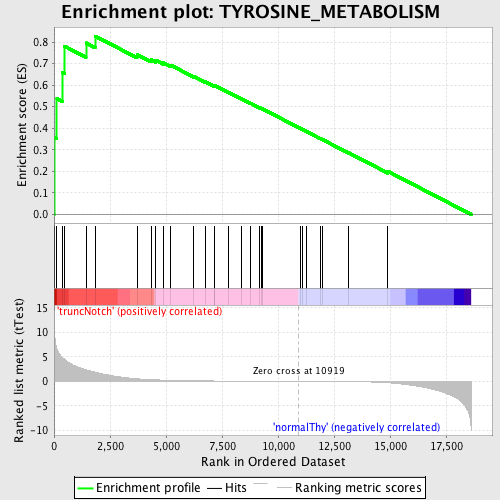
Profile of the Running ES Score & Positions of GeneSet Members on the Rank Ordered List
| Dataset | Set_03_truncNotch_versus_normalThy.phenotype_truncNotch_versus_normalThy.cls #truncNotch_versus_normalThy.phenotype_truncNotch_versus_normalThy.cls #truncNotch_versus_normalThy_repos |
| Phenotype | phenotype_truncNotch_versus_normalThy.cls#truncNotch_versus_normalThy_repos |
| Upregulated in class | truncNotch |
| GeneSet | TYROSINE_METABOLISM |
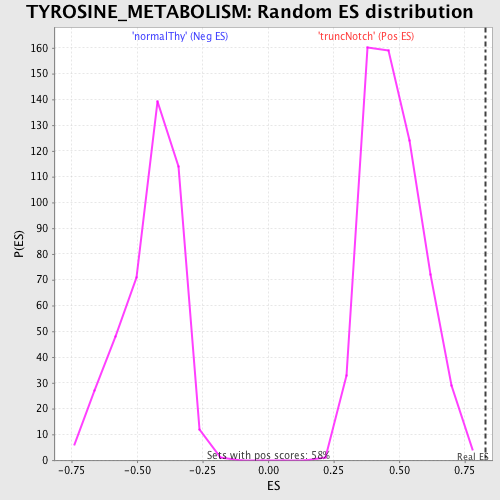
| Enrichment Score (ES) | 0.82757974 |
| Normalized Enrichment Score (NES) | 1.736298 |
| Nominal p-value | 0.0 |
| FDR q-value | 0.009446471 |
| FWER p-Value | 0.098 |
| PROBE | DESCRIPTION (from dataset) | GENE SYMBOL | GENE_TITLE | RANK IN GENE LIST | RANK METRIC SCORE | RUNNING ES | CORE ENRICHMENT | |
|---|---|---|---|---|---|---|---|---|
| 1 | COMT | 360687 510577 5700092 | 3 | 12.727 | 0.3582 | Yes | ||
| 2 | GSTZ1 | 7000451 | 126 | 6.616 | 0.5379 | Yes | ||
| 3 | GOT1 | 2940465 | 372 | 4.801 | 0.6598 | Yes | ||
| 4 | DDC | 670408 | 470 | 4.468 | 0.7804 | Yes | ||
| 5 | GOT2 | 4570164 5220450 | 1424 | 2.366 | 0.7958 | Yes | ||
| 6 | ALDH3B1 | 4210010 6940403 | 1830 | 1.904 | 0.8276 | Yes | ||
| 7 | ALDH3A1 | 580095 | 3702 | 0.524 | 0.7417 | No | ||
| 8 | MAOB | 2970520 3060056 | 4326 | 0.347 | 0.7179 | No | ||
| 9 | ADH1A | 3170427 | 4533 | 0.311 | 0.7156 | No | ||
| 10 | HPD | 3120519 | 4882 | 0.254 | 0.7040 | No | ||
| 11 | FAH | 5390195 | 5202 | 0.214 | 0.6929 | No | ||
| 12 | ADHFE1 | 1990673 6840022 | 6239 | 0.121 | 0.6406 | No | ||
| 13 | AOC3 | 6840129 | 6740 | 0.096 | 0.6164 | No | ||
| 14 | MAOA | 1410039 4610324 | 7141 | 0.080 | 0.5971 | No | ||
| 15 | HGD | 460390 | 7177 | 0.078 | 0.5974 | No | ||
| 16 | ALDH1A3 | 2100270 | 7777 | 0.060 | 0.5669 | No | ||
| 17 | PNMT | 4210563 | 8344 | 0.046 | 0.5378 | No | ||
| 18 | TH | 2100056 | 8777 | 0.037 | 0.5155 | No | ||
| 19 | ABP1 | 1980609 60056 | 9186 | 0.029 | 0.4944 | No | ||
| 20 | DBH | 3610458 | 9241 | 0.028 | 0.4923 | No | ||
| 21 | TAT | 7000427 | 9307 | 0.027 | 0.4896 | No | ||
| 22 | AOX1 | 110082 6290450 | 11009 | -0.001 | 0.3981 | No | ||
| 23 | TPO | 770609 | 11085 | -0.003 | 0.3941 | No | ||
| 24 | ADH4 | 6840301 | 11251 | -0.005 | 0.3854 | No | ||
| 25 | ADH7 | 60465 | 11873 | -0.018 | 0.3525 | No | ||
| 26 | TYR | 5690139 | 12002 | -0.020 | 0.3462 | No | ||
| 27 | DCT | 1090347 3840494 | 13148 | -0.053 | 0.2861 | No | ||
| 28 | AOC2 | 520348 3120008 | 14898 | -0.285 | 0.2000 | No |