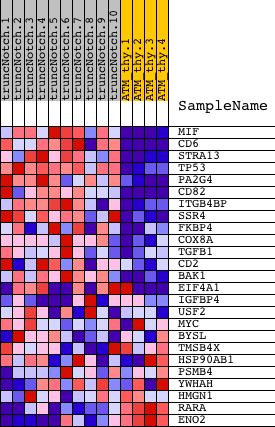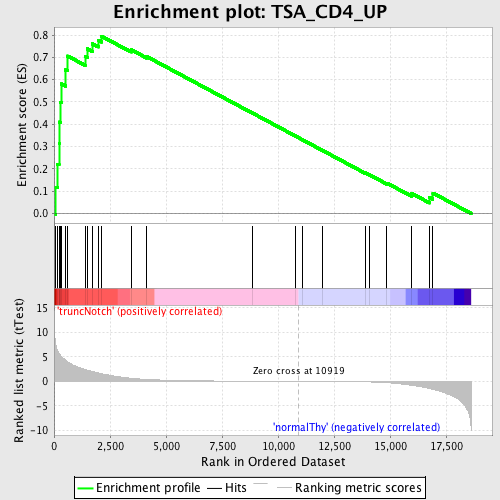
Profile of the Running ES Score & Positions of GeneSet Members on the Rank Ordered List
| Dataset | Set_03_truncNotch_versus_normalThy.phenotype_truncNotch_versus_normalThy.cls #truncNotch_versus_normalThy.phenotype_truncNotch_versus_normalThy.cls #truncNotch_versus_normalThy_repos |
| Phenotype | phenotype_truncNotch_versus_normalThy.cls#truncNotch_versus_normalThy_repos |
| Upregulated in class | truncNotch |
| GeneSet | TSA_CD4_UP |
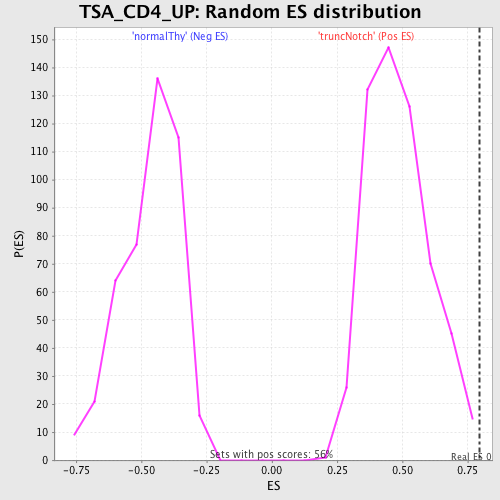
| Enrichment Score (ES) | 0.79510754 |
| Normalized Enrichment Score (NES) | 1.6380395 |
| Nominal p-value | 0.0017793594 |
| FDR q-value | 0.055038225 |
| FWER p-Value | 0.685 |
| PROBE | DESCRIPTION (from dataset) | GENE SYMBOL | GENE_TITLE | RANK IN GENE LIST | RANK METRIC SCORE | RUNNING ES | CORE ENRICHMENT | |
|---|---|---|---|---|---|---|---|---|
| 1 | MIF | 3710332 | 79 | 7.280 | 0.1186 | Yes | ||
| 2 | CD6 | 4150035 5570368 | 153 | 6.335 | 0.2216 | Yes | ||
| 3 | STRA13 | 2650039 6900373 | 222 | 5.731 | 0.3147 | Yes | ||
| 4 | TP53 | 6130707 | 231 | 5.694 | 0.4103 | Yes | ||
| 5 | PA2G4 | 2030463 | 277 | 5.334 | 0.4979 | Yes | ||
| 6 | CD82 | 4780711 | 321 | 5.061 | 0.5810 | Yes | ||
| 7 | ITGB4BP | 1400541 | 510 | 4.316 | 0.6437 | Yes | ||
| 8 | SSR4 | 1340619 4150132 | 602 | 3.983 | 0.7061 | Yes | ||
| 9 | FKBP4 | 870035 | 1386 | 2.416 | 0.7047 | Yes | ||
| 10 | COX8A | 3780500 | 1485 | 2.298 | 0.7382 | Yes | ||
| 11 | TGFB1 | 1940162 | 1704 | 2.021 | 0.7606 | Yes | ||
| 12 | CD2 | 430672 | 1971 | 1.753 | 0.7759 | Yes | ||
| 13 | BAK1 | 6450563 | 2109 | 1.577 | 0.7951 | Yes | ||
| 14 | EIF4A1 | 1990341 2810300 | 3435 | 0.629 | 0.7345 | No | ||
| 15 | IGFBP4 | 2680309 5420441 | 4138 | 0.396 | 0.7034 | No | ||
| 16 | USF2 | 3870368 5570348 6940039 | 8877 | 0.035 | 0.4491 | No | ||
| 17 | MYC | 380541 4670170 | 10764 | 0.003 | 0.3477 | No | ||
| 18 | BYSL | 3170110 | 11073 | -0.003 | 0.3312 | No | ||
| 19 | TMSB4X | 6620114 | 11994 | -0.020 | 0.2821 | No | ||
| 20 | HSP90AB1 | 3170358 5390102 6040093 | 13881 | -0.097 | 0.1822 | No | ||
| 21 | PSMB4 | 520402 | 14062 | -0.114 | 0.1745 | No | ||
| 22 | YWHAH | 1660133 2810053 | 14856 | -0.272 | 0.1364 | No | ||
| 23 | HMGN1 | 2650026 | 15963 | -0.785 | 0.0902 | No | ||
| 24 | RARA | 4050161 | 16763 | -1.457 | 0.0718 | No | ||
| 25 | ENO2 | 2320068 | 16910 | -1.647 | 0.0918 | No |