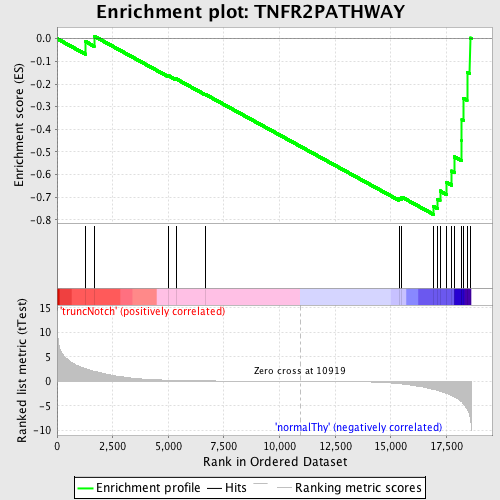
Profile of the Running ES Score & Positions of GeneSet Members on the Rank Ordered List
| Dataset | Set_03_truncNotch_versus_normalThy.phenotype_truncNotch_versus_normalThy.cls #truncNotch_versus_normalThy.phenotype_truncNotch_versus_normalThy.cls #truncNotch_versus_normalThy_repos |
| Phenotype | phenotype_truncNotch_versus_normalThy.cls#truncNotch_versus_normalThy_repos |
| Upregulated in class | normalThy |
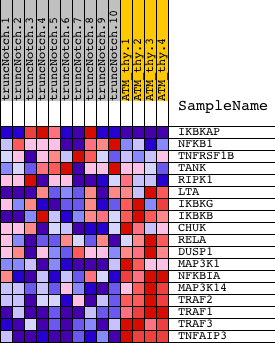
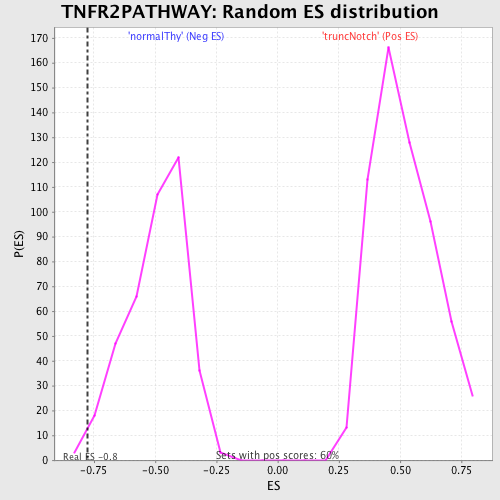
| GeneSet | TNFR2PATHWAY |
| Enrichment Score (ES) | -0.7758442 |
| Normalized Enrichment Score (NES) | -1.5733025 |
| Nominal p-value | 0.0099502485 |
| FDR q-value | 0.39974603 |
| FWER p-Value | 0.996 |
| PROBE | DESCRIPTION (from dataset) | GENE SYMBOL | GENE_TITLE | RANK IN GENE LIST | RANK METRIC SCORE | RUNNING ES | CORE ENRICHMENT | |
|---|---|---|---|---|---|---|---|---|
| 1 | IKBKAP | 1740746 3120364 | 1275 | 2.575 | -0.0126 | No | ||
| 2 | NFKB1 | 5420358 | 1663 | 2.059 | 0.0114 | No | ||
| 3 | TNFRSF1B | 3990035 5860372 | 5016 | 0.237 | -0.1637 | No | ||
| 4 | TANK | 1090020 2060458 2370400 | 5349 | 0.198 | -0.1772 | No | ||
| 5 | RIPK1 | 3190025 | 6652 | 0.100 | -0.2450 | No | ||
| 6 | LTA | 1740088 | 15367 | -0.457 | -0.7036 | No | ||
| 7 | IKBKG | 3450092 3840377 6590592 | 15489 | -0.523 | -0.6987 | No | ||
| 8 | IKBKB | 6840072 | 16924 | -1.659 | -0.7398 | Yes | ||
| 9 | CHUK | 7050736 | 17108 | -1.856 | -0.7093 | Yes | ||
| 10 | RELA | 3830075 | 17212 | -1.973 | -0.6719 | Yes | ||
| 11 | DUSP1 | 6860121 | 17511 | -2.443 | -0.6348 | Yes | ||
| 12 | MAP3K1 | 5360347 | 17735 | -2.897 | -0.5838 | Yes | ||
| 13 | NFKBIA | 1570152 | 17856 | -3.162 | -0.5215 | Yes | ||
| 14 | MAP3K14 | 5890435 | 18190 | -4.158 | -0.4490 | Yes | ||
| 15 | TRAF2 | 5900148 | 18197 | -4.188 | -0.3583 | Yes | ||
| 16 | TRAF1 | 3440735 | 18269 | -4.576 | -0.2626 | Yes | ||
| 17 | TRAF3 | 5690647 | 18426 | -5.642 | -0.1483 | Yes | ||
| 18 | TNFAIP3 | 2900142 | 18558 | -7.288 | 0.0031 | Yes |