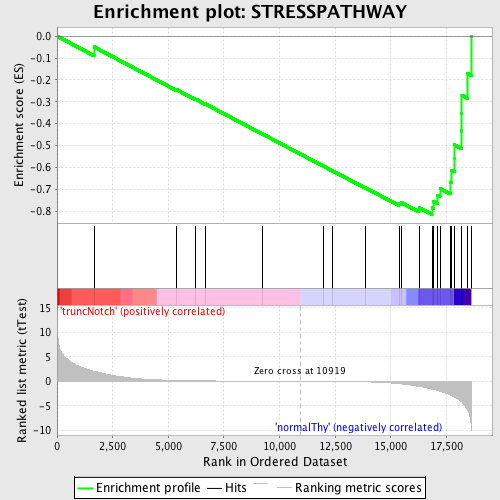
Profile of the Running ES Score & Positions of GeneSet Members on the Rank Ordered List
| Dataset | Set_03_truncNotch_versus_normalThy.phenotype_truncNotch_versus_normalThy.cls #truncNotch_versus_normalThy.phenotype_truncNotch_versus_normalThy.cls #truncNotch_versus_normalThy_repos |
| Phenotype | phenotype_truncNotch_versus_normalThy.cls#truncNotch_versus_normalThy_repos |
| Upregulated in class | normalThy |
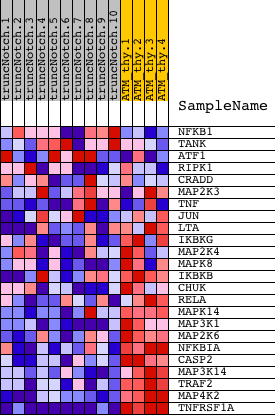
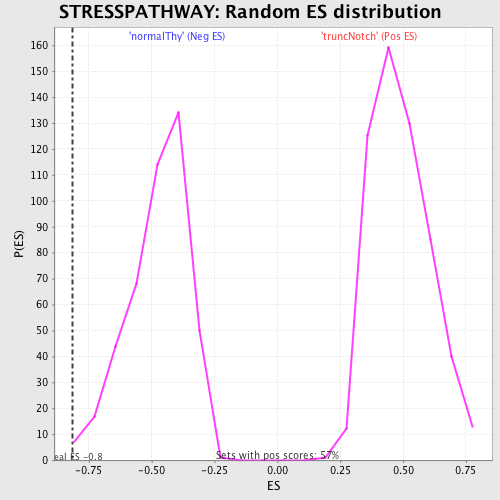
| GeneSet | STRESSPATHWAY |
| Enrichment Score (ES) | -0.81507754 |
| Normalized Enrichment Score (NES) | -1.7127557 |
| Nominal p-value | 0.0022988506 |
| FDR q-value | 0.20368099 |
| FWER p-Value | 0.428 |
| PROBE | DESCRIPTION (from dataset) | GENE SYMBOL | GENE_TITLE | RANK IN GENE LIST | RANK METRIC SCORE | RUNNING ES | CORE ENRICHMENT | |
|---|---|---|---|---|---|---|---|---|
| 1 | NFKB1 | 5420358 | 1663 | 2.059 | -0.0491 | No | ||
| 2 | TANK | 1090020 2060458 2370400 | 5349 | 0.198 | -0.2434 | No | ||
| 3 | ATF1 | 4570142 5550095 | 6207 | 0.123 | -0.2871 | No | ||
| 4 | RIPK1 | 3190025 | 6652 | 0.100 | -0.3090 | No | ||
| 5 | CRADD | 6770520 | 9235 | 0.028 | -0.4474 | No | ||
| 6 | MAP2K3 | 5570193 | 11952 | -0.019 | -0.5931 | No | ||
| 7 | TNF | 6650603 | 12392 | -0.029 | -0.6161 | No | ||
| 8 | JUN | 840170 | 13860 | -0.095 | -0.6931 | No | ||
| 9 | LTA | 1740088 | 15367 | -0.457 | -0.7652 | No | ||
| 10 | IKBKG | 3450092 3840377 6590592 | 15489 | -0.523 | -0.7614 | No | ||
| 11 | MAP2K4 | 5130133 | 16267 | -0.996 | -0.7837 | No | ||
| 12 | MAPK8 | 2640195 | 16851 | -1.569 | -0.7844 | Yes | ||
| 13 | IKBKB | 6840072 | 16924 | -1.659 | -0.7558 | Yes | ||
| 14 | CHUK | 7050736 | 17108 | -1.856 | -0.7293 | Yes | ||
| 15 | RELA | 3830075 | 17212 | -1.973 | -0.6962 | Yes | ||
| 16 | MAPK14 | 5290731 | 17669 | -2.766 | -0.6665 | Yes | ||
| 17 | MAP3K1 | 5360347 | 17735 | -2.897 | -0.6133 | Yes | ||
| 18 | MAP2K6 | 1230056 2940204 | 17853 | -3.155 | -0.5578 | Yes | ||
| 19 | NFKBIA | 1570152 | 17856 | -3.162 | -0.4960 | Yes | ||
| 20 | CASP2 | 2260692 | 18179 | -4.097 | -0.4331 | Yes | ||
| 21 | MAP3K14 | 5890435 | 18190 | -4.158 | -0.3522 | Yes | ||
| 22 | TRAF2 | 5900148 | 18197 | -4.188 | -0.2705 | Yes | ||
| 23 | MAP4K2 | 4200037 | 18449 | -5.843 | -0.1696 | Yes | ||
| 24 | TNFRSF1A | 1090390 6520735 | 18612 | -9.119 | 0.0002 | Yes |