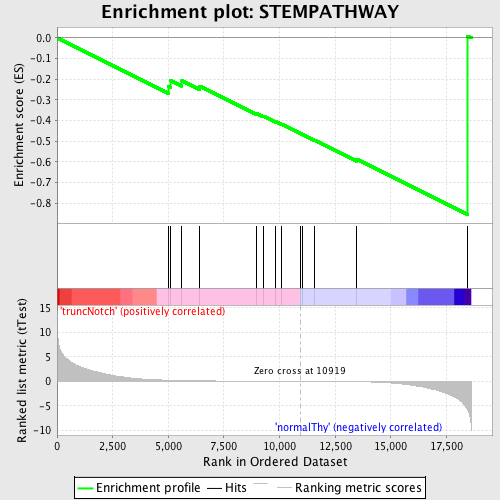
Profile of the Running ES Score & Positions of GeneSet Members on the Rank Ordered List
| Dataset | Set_03_truncNotch_versus_normalThy.phenotype_truncNotch_versus_normalThy.cls #truncNotch_versus_normalThy.phenotype_truncNotch_versus_normalThy.cls #truncNotch_versus_normalThy_repos |
| Phenotype | phenotype_truncNotch_versus_normalThy.cls#truncNotch_versus_normalThy_repos |
| Upregulated in class | normalThy |
| GeneSet | STEMPATHWAY |
| Enrichment Score (ES) | -0.8542491 |
| Normalized Enrichment Score (NES) | -1.5520011 |
| Nominal p-value | 0.0065645515 |
| FDR q-value | 0.414341 |
| FWER p-Value | 0.999 |
| PROBE | DESCRIPTION (from dataset) | GENE SYMBOL | GENE_TITLE | RANK IN GENE LIST | RANK METRIC SCORE | RUNNING ES | CORE ENRICHMENT | |
|---|---|---|---|---|---|---|---|---|
| 1 | IL4 | 6020537 | 4994 | 0.240 | -0.2329 | No | ||
| 2 | CSF3 | 2230193 6660707 | 5107 | 0.224 | -0.2057 | No | ||
| 3 | IL5 | 6370364 1050193 | 5609 | 0.171 | -0.2073 | No | ||
| 4 | EPO | 940180 | 6395 | 0.113 | -0.2327 | No | ||
| 5 | IL9 | 3440338 | 8978 | 0.033 | -0.3667 | No | ||
| 6 | CSF2 | 1660593 | 9269 | 0.028 | -0.3782 | No | ||
| 7 | IL2 | 1770725 | 9836 | 0.018 | -0.4060 | No | ||
| 8 | IL7 | 5360440 | 10107 | 0.014 | -0.4185 | No | ||
| 9 | CSF1 | 3120400 | 10953 | -0.001 | -0.4638 | No | ||
| 10 | IL3 | 2480280 | 11033 | -0.002 | -0.4678 | No | ||
| 11 | IL11 | 1740398 | 11588 | -0.012 | -0.4958 | No | ||
| 12 | IL6 | 380133 | 13465 | -0.069 | -0.5865 | Yes | ||
| 13 | CD4 | 1090010 | 18448 | -5.828 | 0.0090 | Yes |

