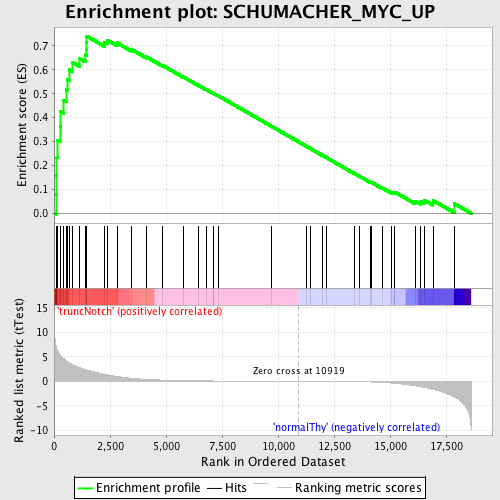
Profile of the Running ES Score & Positions of GeneSet Members on the Rank Ordered List
| Dataset | Set_03_truncNotch_versus_normalThy.phenotype_truncNotch_versus_normalThy.cls #truncNotch_versus_normalThy.phenotype_truncNotch_versus_normalThy.cls #truncNotch_versus_normalThy_repos |
| Phenotype | phenotype_truncNotch_versus_normalThy.cls#truncNotch_versus_normalThy_repos |
| Upregulated in class | truncNotch |
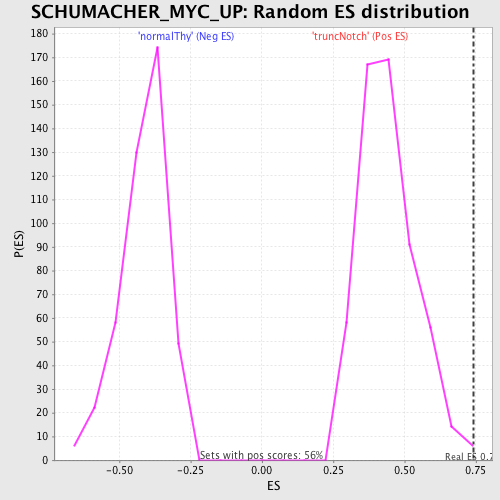
| GeneSet | SCHUMACHER_MYC_UP |
| Enrichment Score (ES) | 0.7408822 |
| Normalized Enrichment Score (NES) | 1.6776967 |
| Nominal p-value | 0.0017825312 |
| FDR q-value | 0.03227132 |
| FWER p-Value | 0.394 |
| PROBE | DESCRIPTION (from dataset) | GENE SYMBOL | GENE_TITLE | RANK IN GENE LIST | RANK METRIC SCORE | RUNNING ES | CORE ENRICHMENT | |
|---|---|---|---|---|---|---|---|---|
| 1 | JTV1 | 460324 | 88 | 7.189 | 0.0795 | Yes | ||
| 2 | BOP1 | 4810040 | 113 | 6.718 | 0.1570 | Yes | ||
| 3 | NOLC1 | 2350195 | 125 | 6.624 | 0.2341 | Yes | ||
| 4 | AEBP1 | 6450707 | 157 | 6.279 | 0.3060 | Yes | ||
| 5 | LDHA | 2190594 | 263 | 5.481 | 0.3646 | Yes | ||
| 6 | DHODH | 3170072 | 278 | 5.332 | 0.4264 | Yes | ||
| 7 | POLD2 | 6400148 | 434 | 4.589 | 0.4718 | Yes | ||
| 8 | CTPS | 70451 1740132 | 540 | 4.258 | 0.5161 | Yes | ||
| 9 | PRDX4 | 3800039 | 610 | 3.963 | 0.5588 | Yes | ||
| 10 | HSPE1 | 3170438 | 670 | 3.793 | 0.6001 | Yes | ||
| 11 | PYCR1 | 6180670 | 835 | 3.361 | 0.6307 | Yes | ||
| 12 | NME1 | 770014 | 1145 | 2.786 | 0.6467 | Yes | ||
| 13 | FKBP4 | 870035 | 1386 | 2.416 | 0.6621 | Yes | ||
| 14 | TFRC | 4050551 | 1439 | 2.350 | 0.6868 | Yes | ||
| 15 | MRPL3 | 1170736 5270025 | 1444 | 2.342 | 0.7141 | Yes | ||
| 16 | POLR2H | 5890242 | 1455 | 2.332 | 0.7409 | Yes | ||
| 17 | DDX21 | 6100446 | 2245 | 1.461 | 0.7155 | No | ||
| 18 | PAICS | 610142 | 2378 | 1.343 | 0.7242 | No | ||
| 19 | CTSC | 2230739 4670408 | 2810 | 0.996 | 0.7126 | No | ||
| 20 | FXN | 4070500 | 3459 | 0.619 | 0.6850 | No | ||
| 21 | EBNA1BP2 | 50369 1400433 6040019 | 4127 | 0.398 | 0.6537 | No | ||
| 22 | NEFH | 630239 | 4847 | 0.259 | 0.6181 | No | ||
| 23 | ABCE1 | 4280050 | 5764 | 0.156 | 0.5706 | No | ||
| 24 | MEST | 4780440 6620292 | 6460 | 0.110 | 0.5344 | No | ||
| 25 | RRS1 | 4560551 | 6805 | 0.094 | 0.5170 | No | ||
| 26 | SLC16A1 | 50433 | 7095 | 0.082 | 0.5024 | No | ||
| 27 | UCHL3 | 1240735 | 7135 | 0.080 | 0.5012 | No | ||
| 28 | DDX10 | 520746 | 7317 | 0.073 | 0.4924 | No | ||
| 29 | MTHFD1 | 5900398 6520427 | 9708 | 0.020 | 0.3639 | No | ||
| 30 | AKAP1 | 110148 1740735 2260019 7000563 | 11256 | -0.005 | 0.2807 | No | ||
| 31 | AUH | 5570152 | 11459 | -0.009 | 0.2699 | No | ||
| 32 | SLC39A14 | 670300 1400093 1990711 | 11985 | -0.020 | 0.2419 | No | ||
| 33 | PBEF1 | 1090278 | 12172 | -0.024 | 0.2321 | No | ||
| 34 | AHCY | 4230605 | 13391 | -0.065 | 0.1673 | No | ||
| 35 | FABP5 | 730452 4810497 | 13624 | -0.078 | 0.1557 | No | ||
| 36 | SLC39A6 | 6100072 | 14136 | -0.122 | 0.1296 | No | ||
| 37 | LRP8 | 3610746 5360035 | 14182 | -0.127 | 0.1287 | No | ||
| 38 | RANBP1 | 430215 1090180 | 14677 | -0.217 | 0.1046 | No | ||
| 39 | VRK1 | 5890603 6900347 | 15058 | -0.329 | 0.0880 | No | ||
| 40 | ACSL1 | 2900520 | 15185 | -0.379 | 0.0857 | No | ||
| 41 | IARS | 460528 1580739 1690008 | 15210 | -0.387 | 0.0889 | No | ||
| 42 | CYP51A1 | 4590427 | 16111 | -0.907 | 0.0511 | No | ||
| 43 | PRPS2 | 3140707 | 16338 | -1.037 | 0.0511 | No | ||
| 44 | GRSF1 | 2100184 | 16549 | -1.235 | 0.0543 | No | ||
| 45 | ATP1B3 | 6040128 | 16913 | -1.649 | 0.0540 | No | ||
| 46 | SLC20A1 | 6420014 | 17874 | -3.207 | 0.0400 | No |