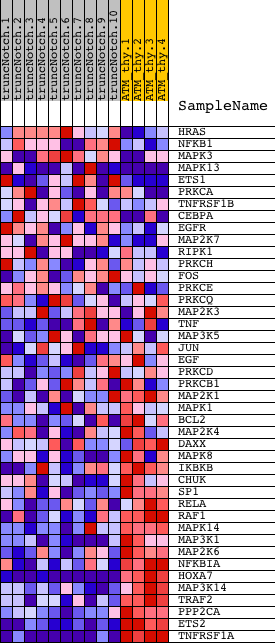
Profile of the Running ES Score & Positions of GeneSet Members on the Rank Ordered List
| Dataset | Set_03_truncNotch_versus_normalThy.phenotype_truncNotch_versus_normalThy.cls #truncNotch_versus_normalThy.phenotype_truncNotch_versus_normalThy.cls #truncNotch_versus_normalThy_repos |
| Phenotype | phenotype_truncNotch_versus_normalThy.cls#truncNotch_versus_normalThy_repos |
| Upregulated in class | normalThy |
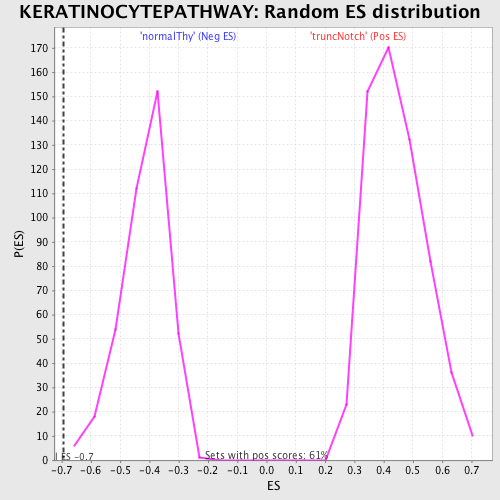
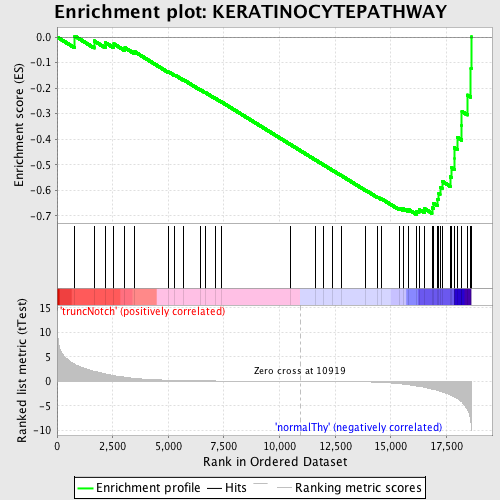
| GeneSet | KERATINOCYTEPATHWAY |
| Enrichment Score (ES) | -0.6947748 |
| Normalized Enrichment Score (NES) | -1.6728793 |
| Nominal p-value | 0.0 |
| FDR q-value | 0.2532677 |
| FWER p-Value | 0.674 |
| PROBE | DESCRIPTION (from dataset) | GENE SYMBOL | GENE_TITLE | RANK IN GENE LIST | RANK METRIC SCORE | RUNNING ES | CORE ENRICHMENT | |
|---|---|---|---|---|---|---|---|---|
| 1 | HRAS | 1980551 | 798 | 3.458 | 0.0035 | No | ||
| 2 | NFKB1 | 5420358 | 1663 | 2.059 | -0.0153 | No | ||
| 3 | MAPK3 | 580161 4780035 | 2169 | 1.520 | -0.0220 | No | ||
| 4 | MAPK13 | 6760215 | 2554 | 1.165 | -0.0270 | No | ||
| 5 | ETS1 | 5270278 6450717 6620465 | 3049 | 0.850 | -0.0422 | No | ||
| 6 | PRKCA | 6400551 | 3491 | 0.607 | -0.0578 | No | ||
| 7 | TNFRSF1B | 3990035 5860372 | 5016 | 0.237 | -0.1367 | No | ||
| 8 | CEBPA | 5690519 | 5297 | 0.204 | -0.1490 | No | ||
| 9 | EGFR | 4920138 6480521 | 5664 | 0.167 | -0.1665 | No | ||
| 10 | MAP2K7 | 2260086 | 6441 | 0.111 | -0.2067 | No | ||
| 11 | RIPK1 | 3190025 | 6652 | 0.100 | -0.2167 | No | ||
| 12 | PRKCH | 5720079 | 7131 | 0.080 | -0.2413 | No | ||
| 13 | FOS | 1850315 | 7375 | 0.071 | -0.2535 | No | ||
| 14 | PRKCE | 5700053 | 10501 | 0.007 | -0.4216 | No | ||
| 15 | PRKCQ | 2260170 3870193 | 11611 | -0.012 | -0.4812 | No | ||
| 16 | MAP2K3 | 5570193 | 11952 | -0.019 | -0.4992 | No | ||
| 17 | TNF | 6650603 | 12392 | -0.029 | -0.5224 | No | ||
| 18 | MAP3K5 | 6020041 6380162 | 12791 | -0.040 | -0.5433 | No | ||
| 19 | JUN | 840170 | 13860 | -0.095 | -0.5996 | No | ||
| 20 | EGF | 5220154 | 14409 | -0.162 | -0.6269 | No | ||
| 21 | PRKCD | 770592 | 14588 | -0.197 | -0.6338 | No | ||
| 22 | PRKCB1 | 870019 3130092 | 15392 | -0.473 | -0.6707 | No | ||
| 23 | MAP2K1 | 840739 | 15572 | -0.564 | -0.6727 | No | ||
| 24 | MAPK1 | 3190193 6200253 | 15779 | -0.675 | -0.6747 | No | ||
| 25 | BCL2 | 730132 1570736 2470138 3800044 4810037 5690068 5860504 6650164 | 16152 | -0.932 | -0.6822 | Yes | ||
| 26 | MAP2K4 | 5130133 | 16267 | -0.996 | -0.6750 | Yes | ||
| 27 | DAXX | 4010647 | 16526 | -1.210 | -0.6726 | Yes | ||
| 28 | MAPK8 | 2640195 | 16851 | -1.569 | -0.6689 | Yes | ||
| 29 | IKBKB | 6840072 | 16924 | -1.659 | -0.6505 | Yes | ||
| 30 | CHUK | 7050736 | 17108 | -1.856 | -0.6354 | Yes | ||
| 31 | SP1 | 6590017 | 17158 | -1.914 | -0.6123 | Yes | ||
| 32 | RELA | 3830075 | 17212 | -1.973 | -0.5886 | Yes | ||
| 33 | RAF1 | 1770600 | 17308 | -2.124 | -0.5652 | Yes | ||
| 34 | MAPK14 | 5290731 | 17669 | -2.766 | -0.5474 | Yes | ||
| 35 | MAP3K1 | 5360347 | 17735 | -2.897 | -0.5119 | Yes | ||
| 36 | MAP2K6 | 1230056 2940204 | 17853 | -3.155 | -0.4758 | Yes | ||
| 37 | NFKBIA | 1570152 | 17856 | -3.162 | -0.4333 | Yes | ||
| 38 | HOXA7 | 5910152 | 17999 | -3.526 | -0.3936 | Yes | ||
| 39 | MAP3K14 | 5890435 | 18190 | -4.158 | -0.3479 | Yes | ||
| 40 | TRAF2 | 5900148 | 18197 | -4.188 | -0.2919 | Yes | ||
| 41 | PPP2CA | 3990113 | 18447 | -5.823 | -0.2270 | Yes | ||
| 42 | ETS2 | 360451 | 18601 | -8.428 | -0.1219 | Yes | ||
| 43 | TNFRSF1A | 1090390 6520735 | 18612 | -9.119 | 0.0002 | Yes |