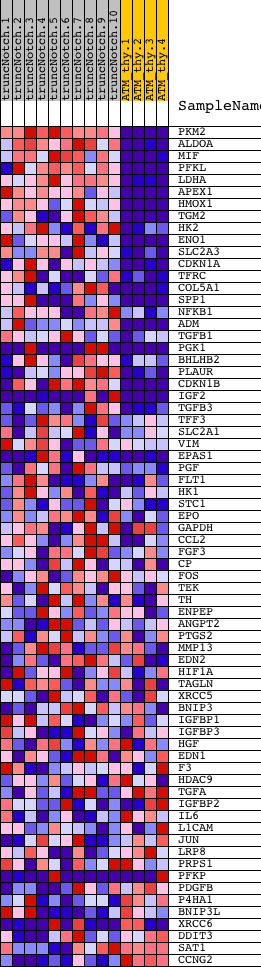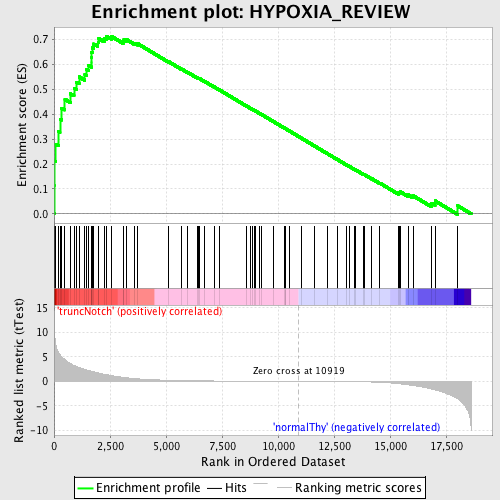
Profile of the Running ES Score & Positions of GeneSet Members on the Rank Ordered List
| Dataset | Set_03_truncNotch_versus_normalThy.phenotype_truncNotch_versus_normalThy.cls #truncNotch_versus_normalThy.phenotype_truncNotch_versus_normalThy.cls #truncNotch_versus_normalThy_repos |
| Phenotype | phenotype_truncNotch_versus_normalThy.cls#truncNotch_versus_normalThy_repos |
| Upregulated in class | truncNotch |
| GeneSet | HYPOXIA_REVIEW |
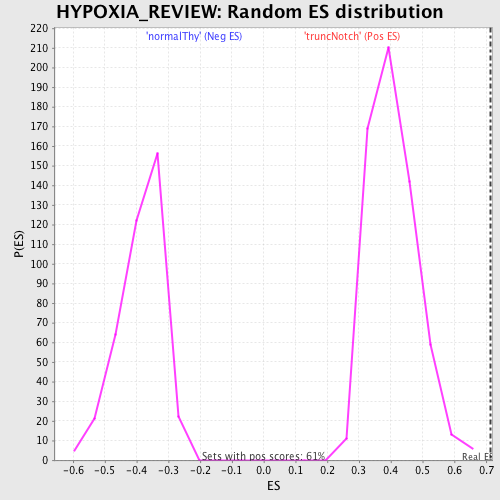
| Enrichment Score (ES) | 0.7133746 |
| Normalized Enrichment Score (NES) | 1.7496144 |
| Nominal p-value | 0.0 |
| FDR q-value | 0.0075049577 |
| FWER p-Value | 0.063 |
| PROBE | DESCRIPTION (from dataset) | GENE SYMBOL | GENE_TITLE | RANK IN GENE LIST | RANK METRIC SCORE | RUNNING ES | CORE ENRICHMENT | |
|---|---|---|---|---|---|---|---|---|
| 1 | PKM2 | 6520403 70500 | 8 | 11.751 | 0.1136 | Yes | ||
| 2 | ALDOA | 6290672 | 14 | 10.281 | 0.2132 | Yes | ||
| 3 | MIF | 3710332 | 79 | 7.280 | 0.2804 | Yes | ||
| 4 | PFKL | 6200167 | 205 | 5.841 | 0.3304 | Yes | ||
| 5 | LDHA | 2190594 | 263 | 5.481 | 0.3805 | Yes | ||
| 6 | APEX1 | 3190519 | 339 | 4.957 | 0.4246 | Yes | ||
| 7 | HMOX1 | 1740687 | 484 | 4.425 | 0.4598 | Yes | ||
| 8 | TGM2 | 5360452 | 729 | 3.659 | 0.4821 | Yes | ||
| 9 | HK2 | 2640722 | 889 | 3.249 | 0.5051 | Yes | ||
| 10 | ENO1 | 5340128 | 1000 | 3.040 | 0.5287 | Yes | ||
| 11 | SLC2A3 | 1990377 | 1119 | 2.834 | 0.5498 | Yes | ||
| 12 | CDKN1A | 4050088 6400706 | 1374 | 2.431 | 0.5597 | Yes | ||
| 13 | TFRC | 4050551 | 1439 | 2.350 | 0.5791 | Yes | ||
| 14 | COL5A1 | 2230050 | 1539 | 2.226 | 0.5954 | Yes | ||
| 15 | SPP1 | 2470609 | 1662 | 2.060 | 0.6088 | Yes | ||
| 16 | NFKB1 | 5420358 | 1663 | 2.059 | 0.6288 | Yes | ||
| 17 | ADM | 4810121 | 1672 | 2.052 | 0.6483 | Yes | ||
| 18 | TGFB1 | 1940162 | 1704 | 2.021 | 0.6662 | Yes | ||
| 19 | PGK1 | 1570494 630300 | 1768 | 1.961 | 0.6818 | Yes | ||
| 20 | BHLHB2 | 7040603 | 1959 | 1.760 | 0.6887 | Yes | ||
| 21 | PLAUR | 5910280 | 1994 | 1.727 | 0.7036 | Yes | ||
| 22 | CDKN1B | 3800025 6450044 | 2238 | 1.469 | 0.7048 | Yes | ||
| 23 | IGF2 | 6510020 | 2329 | 1.386 | 0.7134 | Yes | ||
| 24 | TGFB3 | 1070041 | 2553 | 1.165 | 0.7127 | No | ||
| 25 | TFF3 | 1580129 | 3083 | 0.829 | 0.6922 | No | ||
| 26 | SLC2A1 | 2100609 | 3116 | 0.805 | 0.6983 | No | ||
| 27 | VIM | 20431 | 3211 | 0.749 | 0.7005 | No | ||
| 28 | EPAS1 | 5290156 | 3587 | 0.565 | 0.6857 | No | ||
| 29 | PGF | 4810593 | 3740 | 0.512 | 0.6825 | No | ||
| 30 | FLT1 | 3830167 4920438 | 5109 | 0.224 | 0.6109 | No | ||
| 31 | HK1 | 4280402 | 5684 | 0.164 | 0.5816 | No | ||
| 32 | STC1 | 360161 | 5963 | 0.138 | 0.5679 | No | ||
| 33 | EPO | 940180 | 6395 | 0.113 | 0.5458 | No | ||
| 34 | GAPDH | 110022 430039 6220161 | 6462 | 0.110 | 0.5433 | No | ||
| 35 | CCL2 | 4760019 | 6477 | 0.109 | 0.5436 | No | ||
| 36 | FGF3 | 4230685 | 6723 | 0.097 | 0.5313 | No | ||
| 37 | CP | 2570484 | 7137 | 0.080 | 0.5099 | No | ||
| 38 | FOS | 1850315 | 7375 | 0.071 | 0.4978 | No | ||
| 39 | TEK | 6350541 | 8598 | 0.040 | 0.4323 | No | ||
| 40 | TH | 2100056 | 8777 | 0.037 | 0.4230 | No | ||
| 41 | ENPEP | 130373 | 8844 | 0.035 | 0.4198 | No | ||
| 42 | ANGPT2 | 1230458 5720706 6040605 | 8923 | 0.033 | 0.4159 | No | ||
| 43 | PTGS2 | 2510301 3170369 | 9006 | 0.032 | 0.4118 | No | ||
| 44 | MMP13 | 510471 3940097 | 9174 | 0.029 | 0.4031 | No | ||
| 45 | EDN2 | 6760647 | 9268 | 0.028 | 0.3984 | No | ||
| 46 | HIF1A | 5670605 | 9785 | 0.019 | 0.3707 | No | ||
| 47 | TAGLN | 6660280 | 10268 | 0.011 | 0.3448 | No | ||
| 48 | XRCC5 | 7100286 | 10318 | 0.010 | 0.3423 | No | ||
| 49 | BNIP3 | 3140270 | 10326 | 0.010 | 0.3420 | No | ||
| 50 | IGFBP1 | 5720435 | 10500 | 0.007 | 0.3328 | No | ||
| 51 | IGFBP3 | 2370500 | 11032 | -0.002 | 0.3041 | No | ||
| 52 | HGF | 3360593 | 11644 | -0.013 | 0.2713 | No | ||
| 53 | EDN1 | 1770047 | 12189 | -0.025 | 0.2422 | No | ||
| 54 | F3 | 2940180 | 12659 | -0.036 | 0.2173 | No | ||
| 55 | HDAC9 | 1990010 2260133 | 13042 | -0.049 | 0.1972 | No | ||
| 56 | TGFA | 1570332 | 13197 | -0.055 | 0.1894 | No | ||
| 57 | IGFBP2 | 5220563 | 13396 | -0.065 | 0.1794 | No | ||
| 58 | IL6 | 380133 | 13465 | -0.069 | 0.1764 | No | ||
| 59 | L1CAM | 4850021 | 13830 | -0.093 | 0.1576 | No | ||
| 60 | JUN | 840170 | 13860 | -0.095 | 0.1570 | No | ||
| 61 | LRP8 | 3610746 5360035 | 14182 | -0.127 | 0.1409 | No | ||
| 62 | PRPS1 | 6350129 | 14534 | -0.186 | 0.1238 | No | ||
| 63 | PFKP | 70138 6760040 1170278 | 15394 | -0.474 | 0.0821 | No | ||
| 64 | PDGFB | 3060440 6370008 | 15405 | -0.480 | 0.0862 | No | ||
| 65 | P4HA1 | 2630692 | 15450 | -0.502 | 0.0887 | No | ||
| 66 | BNIP3L | 1940347 | 15806 | -0.692 | 0.0763 | No | ||
| 67 | XRCC6 | 2850450 3870528 | 16034 | -0.844 | 0.0722 | No | ||
| 68 | DDIT3 | 780373 | 16858 | -1.577 | 0.0432 | No | ||
| 69 | SAT1 | 4570463 | 17006 | -1.733 | 0.0521 | No | ||
| 70 | CCNG2 | 3190095 | 18019 | -3.572 | 0.0322 | No |