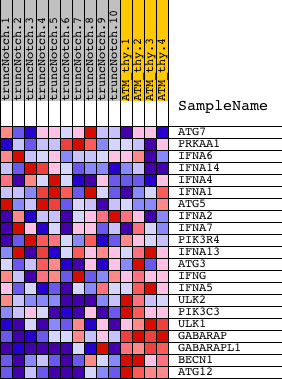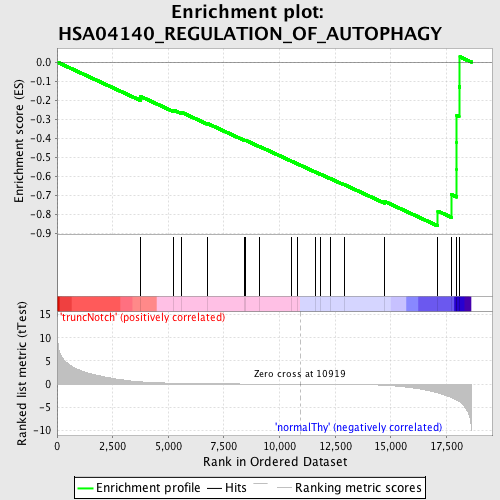
Profile of the Running ES Score & Positions of GeneSet Members on the Rank Ordered List
| Dataset | Set_03_truncNotch_versus_normalThy.phenotype_truncNotch_versus_normalThy.cls #truncNotch_versus_normalThy.phenotype_truncNotch_versus_normalThy.cls #truncNotch_versus_normalThy_repos |
| Phenotype | phenotype_truncNotch_versus_normalThy.cls#truncNotch_versus_normalThy_repos |
| Upregulated in class | normalThy |
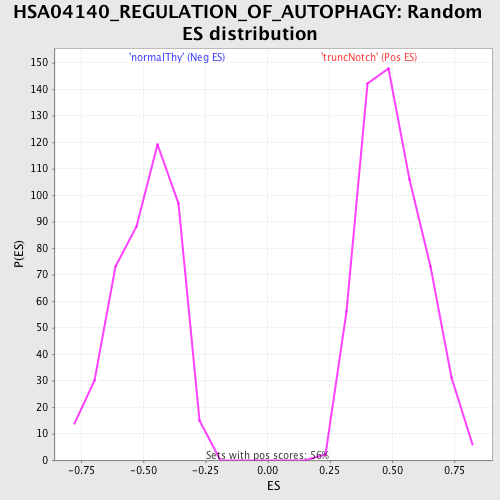
| GeneSet | HSA04140_REGULATION_OF_AUTOPHAGY |
| Enrichment Score (ES) | -0.85977143 |
| Normalized Enrichment Score (NES) | -1.7571667 |
| Nominal p-value | 0.0 |
| FDR q-value | 0.23762795 |
| FWER p-Value | 0.2 |
| PROBE | DESCRIPTION (from dataset) | GENE SYMBOL | GENE_TITLE | RANK IN GENE LIST | RANK METRIC SCORE | RUNNING ES | CORE ENRICHMENT | |
|---|---|---|---|---|---|---|---|---|
| 1 | ATG7 | 3940619 | 3751 | 0.509 | -0.1805 | No | ||
| 2 | PRKAA1 | 510156 | 5238 | 0.210 | -0.2517 | No | ||
| 3 | IFNA6 | 5550414 | 5598 | 0.172 | -0.2638 | No | ||
| 4 | IFNA14 | 4540142 | 6738 | 0.097 | -0.3210 | No | ||
| 5 | IFNA4 | 1940025 | 8418 | 0.045 | -0.4095 | No | ||
| 6 | IFNA1 | 5390592 | 8476 | 0.043 | -0.4107 | No | ||
| 7 | ATG5 | 6200433 5360324 | 9113 | 0.030 | -0.4437 | No | ||
| 8 | IFNA2 | 4150162 | 10548 | 0.007 | -0.5205 | No | ||
| 9 | IFNA7 | 2510239 | 10826 | 0.001 | -0.5354 | No | ||
| 10 | PIK3R4 | 1990132 | 11627 | -0.013 | -0.5779 | No | ||
| 11 | IFNA13 | 1980086 | 11834 | -0.017 | -0.5882 | No | ||
| 12 | ATG3 | 5550647 6350050 | 12279 | -0.026 | -0.6110 | No | ||
| 13 | IFNG | 5670592 | 12899 | -0.044 | -0.6425 | No | ||
| 14 | IFNA5 | 4780072 | 14708 | -0.226 | -0.7303 | No | ||
| 15 | ULK2 | 50041 5050176 | 17117 | -1.866 | -0.7820 | Yes | ||
| 16 | PIK3C3 | 6590717 | 17718 | -2.857 | -0.6951 | Yes | ||
| 17 | ULK1 | 6100315 | 17957 | -3.420 | -0.5654 | Yes | ||
| 18 | GABARAP | 1450286 | 17962 | -3.439 | -0.4222 | Yes | ||
| 19 | GABARAPL1 | 2810458 | 17968 | -3.447 | -0.2787 | Yes | ||
| 20 | BECN1 | 3840433 | 18066 | -3.701 | -0.1296 | Yes | ||
| 21 | ATG12 | 780167 | 18108 | -3.817 | 0.0273 | Yes |