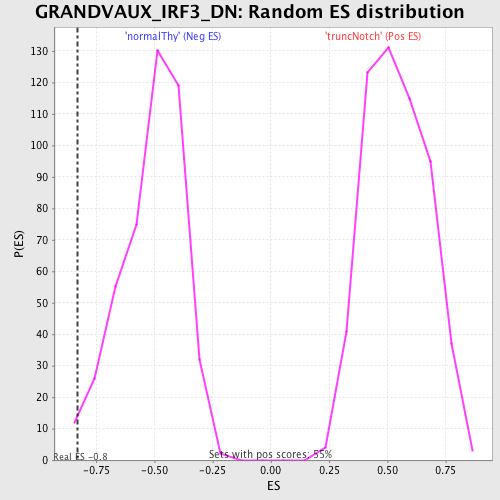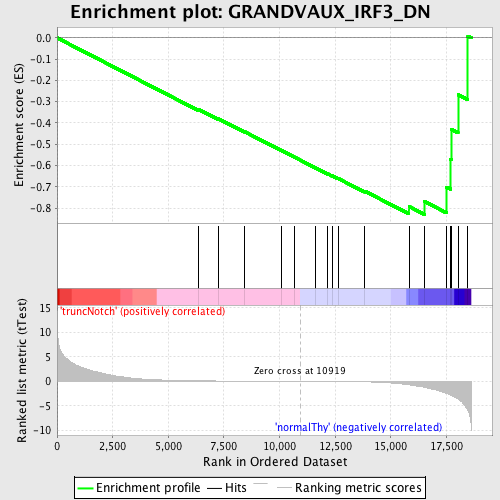
Profile of the Running ES Score & Positions of GeneSet Members on the Rank Ordered List
| Dataset | Set_03_truncNotch_versus_normalThy.phenotype_truncNotch_versus_normalThy.cls #truncNotch_versus_normalThy.phenotype_truncNotch_versus_normalThy.cls #truncNotch_versus_normalThy_repos |
| Phenotype | phenotype_truncNotch_versus_normalThy.cls#truncNotch_versus_normalThy_repos |
| Upregulated in class | normalThy |
| GeneSet | GRANDVAUX_IRF3_DN |
| Enrichment Score (ES) | -0.82999885 |
| Normalized Enrichment Score (NES) | -1.6336578 |
| Nominal p-value | 0.0088691795 |
| FDR q-value | 0.30022562 |
| FWER p-Value | 0.88 |
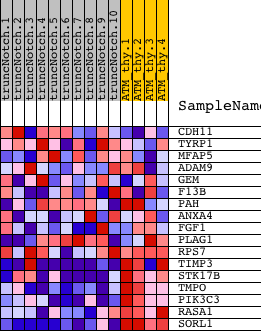
| PROBE | DESCRIPTION (from dataset) | GENE SYMBOL | GENE_TITLE | RANK IN GENE LIST | RANK METRIC SCORE | RUNNING ES | CORE ENRICHMENT | |
|---|---|---|---|---|---|---|---|---|
| 1 | CDH11 | 1230133 2100180 4610110 | 6336 | 0.116 | -0.3348 | No | ||
| 2 | TYRP1 | 3170450 5690204 6290092 | 7234 | 0.076 | -0.3792 | No | ||
| 3 | MFAP5 | 4920139 | 8416 | 0.045 | -0.4405 | No | ||
| 4 | ADAM9 | 3360411 | 10075 | 0.014 | -0.5289 | No | ||
| 5 | GEM | 5290082 | 10681 | 0.004 | -0.5612 | No | ||
| 6 | F13B | 6220278 | 11630 | -0.013 | -0.6115 | No | ||
| 7 | PAH | 3800309 | 12167 | -0.024 | -0.6392 | No | ||
| 8 | ANXA4 | 1400315 | 12366 | -0.029 | -0.6484 | No | ||
| 9 | FGF1 | 4780435 5670601 | 12642 | -0.036 | -0.6614 | No | ||
| 10 | PLAG1 | 1450142 3870139 6520039 | 13817 | -0.093 | -0.7198 | No | ||
| 11 | RPS7 | 6860113 | 15816 | -0.696 | -0.7923 | Yes | ||
| 12 | TIMP3 | 1450504 1980270 | 16519 | -1.205 | -0.7695 | Yes | ||
| 13 | STK17B | 130091 | 17497 | -2.408 | -0.7011 | Yes | ||
| 14 | TMPO | 4050494 | 17681 | -2.779 | -0.5713 | Yes | ||
| 15 | PIK3C3 | 6590717 | 17718 | -2.857 | -0.4298 | Yes | ||
| 16 | RASA1 | 1240315 | 18023 | -3.576 | -0.2665 | Yes | ||
| 17 | SORL1 | 630204 | 18462 | -5.940 | 0.0083 | Yes |