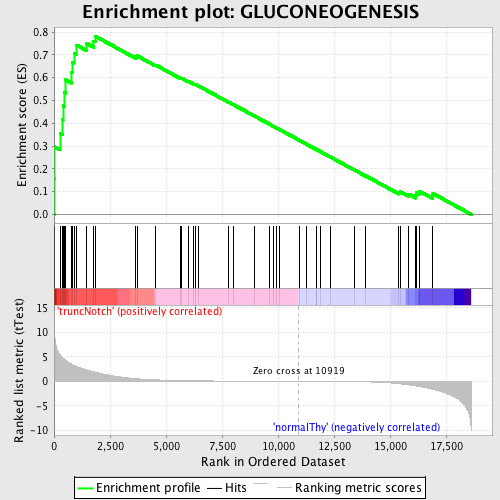
Profile of the Running ES Score & Positions of GeneSet Members on the Rank Ordered List
| Dataset | Set_03_truncNotch_versus_normalThy.phenotype_truncNotch_versus_normalThy.cls #truncNotch_versus_normalThy.phenotype_truncNotch_versus_normalThy.cls #truncNotch_versus_normalThy_repos |
| Phenotype | phenotype_truncNotch_versus_normalThy.cls#truncNotch_versus_normalThy_repos |
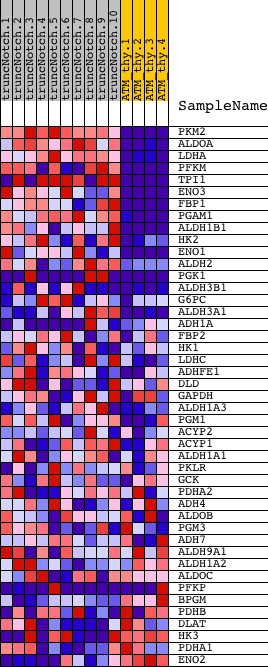
| Upregulated in class | truncNotch |
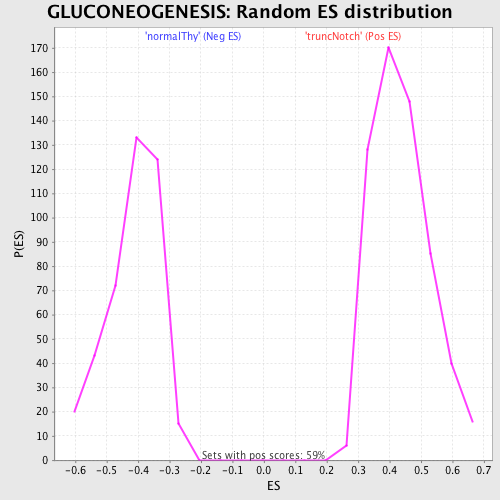
| GeneSet | GLUCONEOGENESIS |
| Enrichment Score (ES) | 0.7825935 |
| Normalized Enrichment Score (NES) | 1.7975091 |
| Nominal p-value | 0.0 |
| FDR q-value | 0.0068882923 |
| FWER p-Value | 0.015 |
| PROBE | DESCRIPTION (from dataset) | GENE SYMBOL | GENE_TITLE | RANK IN GENE LIST | RANK METRIC SCORE | RUNNING ES | CORE ENRICHMENT | |
|---|---|---|---|---|---|---|---|---|
| 1 | PKM2 | 6520403 70500 | 8 | 11.751 | 0.1580 | Yes | ||
| 2 | ALDOA | 6290672 | 14 | 10.281 | 0.2964 | Yes | ||
| 3 | LDHA | 2190594 | 263 | 5.481 | 0.3570 | Yes | ||
| 4 | PFKM | 1990156 5720168 | 383 | 4.761 | 0.4148 | Yes | ||
| 5 | TPI1 | 1500215 2100154 | 397 | 4.690 | 0.4774 | Yes | ||
| 6 | ENO3 | 5270136 | 448 | 4.550 | 0.5360 | Yes | ||
| 7 | FBP1 | 1470762 | 517 | 4.307 | 0.5905 | Yes | ||
| 8 | PGAM1 | 2570133 | 776 | 3.540 | 0.6243 | Yes | ||
| 9 | ALDH1B1 | 610195 | 813 | 3.426 | 0.6686 | Yes | ||
| 10 | HK2 | 2640722 | 889 | 3.249 | 0.7084 | Yes | ||
| 11 | ENO1 | 5340128 | 1000 | 3.040 | 0.7434 | Yes | ||
| 12 | ALDH2 | 4230019 | 1448 | 2.340 | 0.7509 | Yes | ||
| 13 | PGK1 | 1570494 630300 | 1768 | 1.961 | 0.7602 | Yes | ||
| 14 | ALDH3B1 | 4210010 6940403 | 1830 | 1.904 | 0.7826 | Yes | ||
| 15 | G6PC | 430093 | 3648 | 0.539 | 0.6920 | No | ||
| 16 | ALDH3A1 | 580095 | 3702 | 0.524 | 0.6962 | No | ||
| 17 | ADH1A | 3170427 | 4533 | 0.311 | 0.6557 | No | ||
| 18 | FBP2 | 1580193 | 5642 | 0.169 | 0.5984 | No | ||
| 19 | HK1 | 4280402 | 5684 | 0.164 | 0.5984 | No | ||
| 20 | LDHC | 2030458 6100463 | 5978 | 0.137 | 0.5844 | No | ||
| 21 | ADHFE1 | 1990673 6840022 | 6239 | 0.121 | 0.5721 | No | ||
| 22 | DLD | 4150403 6590341 | 6289 | 0.118 | 0.5710 | No | ||
| 23 | GAPDH | 110022 430039 6220161 | 6462 | 0.110 | 0.5633 | No | ||
| 24 | ALDH1A3 | 2100270 | 7777 | 0.060 | 0.4933 | No | ||
| 25 | PGM1 | 3840408 | 8006 | 0.054 | 0.4818 | No | ||
| 26 | ACYP2 | 2510605 | 8963 | 0.033 | 0.4307 | No | ||
| 27 | ACYP1 | 6380403 | 9622 | 0.022 | 0.3956 | No | ||
| 28 | ALDH1A1 | 6520706 | 9775 | 0.019 | 0.3877 | No | ||
| 29 | PKLR | 1170400 2470114 | 9931 | 0.016 | 0.3795 | No | ||
| 30 | GCK | 2370273 | 10061 | 0.014 | 0.3728 | No | ||
| 31 | PDHA2 | 2630438 | 10970 | -0.001 | 0.3239 | No | ||
| 32 | ADH4 | 6840301 | 11251 | -0.005 | 0.3089 | No | ||
| 33 | ALDOB | 4730324 | 11701 | -0.014 | 0.2849 | No | ||
| 34 | PGM3 | 2570465 | 11718 | -0.015 | 0.2843 | No | ||
| 35 | ADH7 | 60465 | 11873 | -0.018 | 0.2762 | No | ||
| 36 | ALDH9A1 | 4810047 | 12349 | -0.028 | 0.2510 | No | ||
| 37 | ALDH1A2 | 2320301 | 13423 | -0.066 | 0.1941 | No | ||
| 38 | ALDOC | 450121 610427 | 13912 | -0.100 | 0.1692 | No | ||
| 39 | PFKP | 70138 6760040 1170278 | 15394 | -0.474 | 0.0958 | No | ||
| 40 | BPGM | 5080520 | 15449 | -0.501 | 0.0997 | No | ||
| 41 | PDHB | 70215 610086 | 15820 | -0.698 | 0.0892 | No | ||
| 42 | DLAT | 430452 | 16144 | -0.926 | 0.0843 | No | ||
| 43 | HK3 | 3190288 6510142 | 16187 | -0.956 | 0.0949 | No | ||
| 44 | PDHA1 | 5550397 | 16299 | -1.004 | 0.1025 | No | ||
| 45 | ENO2 | 2320068 | 16910 | -1.647 | 0.0919 | No |