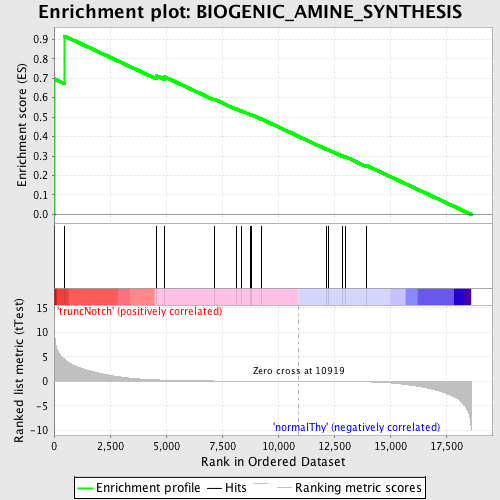
Profile of the Running ES Score & Positions of GeneSet Members on the Rank Ordered List
| Dataset | Set_03_truncNotch_versus_normalThy.phenotype_truncNotch_versus_normalThy.cls #truncNotch_versus_normalThy.phenotype_truncNotch_versus_normalThy.cls #truncNotch_versus_normalThy_repos |
| Phenotype | phenotype_truncNotch_versus_normalThy.cls#truncNotch_versus_normalThy_repos |
| Upregulated in class | truncNotch |
| GeneSet | BIOGENIC_AMINE_SYNTHESIS |
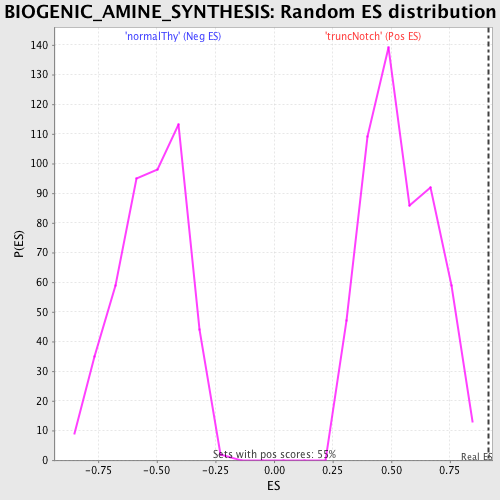
| Enrichment Score (ES) | 0.91615003 |
| Normalized Enrichment Score (NES) | 1.7140785 |
| Nominal p-value | 0.0 |
| FDR q-value | 0.015040042 |
| FWER p-Value | 0.177 |
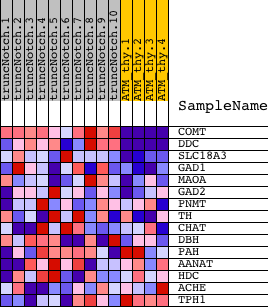
| PROBE | DESCRIPTION (from dataset) | GENE SYMBOL | GENE_TITLE | RANK IN GENE LIST | RANK METRIC SCORE | RUNNING ES | CORE ENRICHMENT | |
|---|---|---|---|---|---|---|---|---|
| 1 | COMT | 360687 510577 5700092 | 3 | 12.727 | 0.6966 | Yes | ||
| 2 | DDC | 670408 | 470 | 4.468 | 0.9162 | Yes | ||
| 3 | SLC18A3 | 3060035 | 4565 | 0.305 | 0.7128 | No | ||
| 4 | GAD1 | 2360035 3140167 | 4919 | 0.249 | 0.7074 | No | ||
| 5 | MAOA | 1410039 4610324 | 7141 | 0.080 | 0.5924 | No | ||
| 6 | GAD2 | 1400088 | 8128 | 0.051 | 0.5421 | No | ||
| 7 | PNMT | 4210563 | 8344 | 0.046 | 0.5331 | No | ||
| 8 | TH | 2100056 | 8777 | 0.037 | 0.5119 | No | ||
| 9 | CHAT | 6840603 | 8811 | 0.036 | 0.5121 | No | ||
| 10 | DBH | 3610458 | 9241 | 0.028 | 0.4906 | No | ||
| 11 | PAH | 3800309 | 12167 | -0.024 | 0.3346 | No | ||
| 12 | AANAT | 610609 | 12259 | -0.026 | 0.3312 | No | ||
| 13 | HDC | 4150463 | 12869 | -0.043 | 0.3007 | No | ||
| 14 | ACHE | 5290750 | 12986 | -0.047 | 0.2971 | No | ||
| 15 | TPH1 | 780180 | 13924 | -0.101 | 0.2522 | No |