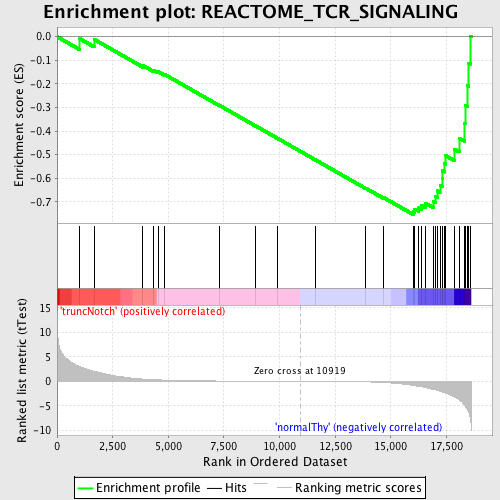
Profile of the Running ES Score & Positions of GeneSet Members on the Rank Ordered List
| Dataset | Set_03_truncNotch_versus_normalThy.phenotype_truncNotch_versus_normalThy.cls #truncNotch_versus_normalThy.phenotype_truncNotch_versus_normalThy.cls #truncNotch_versus_normalThy_repos |
| Phenotype | phenotype_truncNotch_versus_normalThy.cls#truncNotch_versus_normalThy_repos |
| Upregulated in class | normalThy |
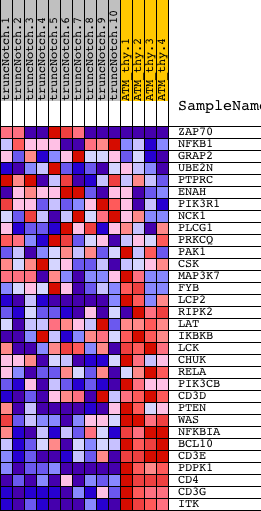
| GeneSet | REACTOME_TCR_SIGNALING |
| Enrichment Score (ES) | -0.7539413 |
| Normalized Enrichment Score (NES) | -1.7140907 |
| Nominal p-value | 0.007125891 |
| FDR q-value | 0.048599456 |
| FWER p-Value | 0.219 |
| PROBE | DESCRIPTION (from dataset) | GENE SYMBOL | GENE_TITLE | RANK IN GENE LIST | RANK METRIC SCORE | RUNNING ES | CORE ENRICHMENT | |
|---|---|---|---|---|---|---|---|---|
| 1 | ZAP70 | 1410494 2260504 | 1024 | 2.988 | -0.0088 | No | ||
| 2 | NFKB1 | 5420358 | 1663 | 2.059 | -0.0112 | No | ||
| 3 | GRAP2 | 7100441 1410647 | 3859 | 0.474 | -0.1220 | No | ||
| 4 | UBE2N | 520369 2900047 | 4340 | 0.345 | -0.1424 | No | ||
| 5 | PTPRC | 130402 5290148 | 4545 | 0.309 | -0.1486 | No | ||
| 6 | ENAH | 1690292 5700300 | 4829 | 0.261 | -0.1598 | No | ||
| 7 | PIK3R1 | 4730671 | 7309 | 0.074 | -0.2921 | No | ||
| 8 | NCK1 | 6200575 6510050 | 8925 | 0.033 | -0.3784 | No | ||
| 9 | PLCG1 | 6020369 | 9889 | 0.017 | -0.4300 | No | ||
| 10 | PRKCQ | 2260170 3870193 | 11611 | -0.012 | -0.5224 | No | ||
| 11 | PAK1 | 4540315 | 13880 | -0.097 | -0.6429 | No | ||
| 12 | CSK | 6350593 | 14670 | -0.215 | -0.6821 | No | ||
| 13 | MAP3K7 | 6040068 | 16007 | -0.821 | -0.7412 | Yes | ||
| 14 | FYB | 1690440 | 16076 | -0.876 | -0.7313 | Yes | ||
| 15 | LCP2 | 2680066 6650707 | 16263 | -0.994 | -0.7259 | Yes | ||
| 16 | RIPK2 | 5050072 6290632 | 16369 | -1.063 | -0.7150 | Yes | ||
| 17 | LAT | 3170025 | 16561 | -1.244 | -0.7060 | Yes | ||
| 18 | IKBKB | 6840072 | 16924 | -1.659 | -0.6998 | Yes | ||
| 19 | LCK | 3360142 | 17003 | -1.730 | -0.6772 | Yes | ||
| 20 | CHUK | 7050736 | 17108 | -1.856 | -0.6540 | Yes | ||
| 21 | RELA | 3830075 | 17212 | -1.973 | -0.6290 | Yes | ||
| 22 | PIK3CB | 3800600 | 17306 | -2.122 | -0.6011 | Yes | ||
| 23 | CD3D | 2810739 | 17311 | -2.126 | -0.5683 | Yes | ||
| 24 | PTEN | 3390064 | 17414 | -2.288 | -0.5383 | Yes | ||
| 25 | WAS | 5270193 | 17462 | -2.355 | -0.5043 | Yes | ||
| 26 | NFKBIA | 1570152 | 17856 | -3.162 | -0.4765 | Yes | ||
| 27 | BCL10 | 2360397 | 18081 | -3.744 | -0.4305 | Yes | ||
| 28 | CD3E | 3800056 | 18329 | -4.901 | -0.3678 | Yes | ||
| 29 | PDPK1 | 6650168 | 18338 | -4.943 | -0.2916 | Yes | ||
| 30 | CD4 | 1090010 | 18448 | -5.828 | -0.2071 | Yes | ||
| 31 | CD3G | 2680288 | 18503 | -6.298 | -0.1124 | Yes | ||
| 32 | ITK | 2230592 | 18571 | -7.638 | 0.0024 | Yes |