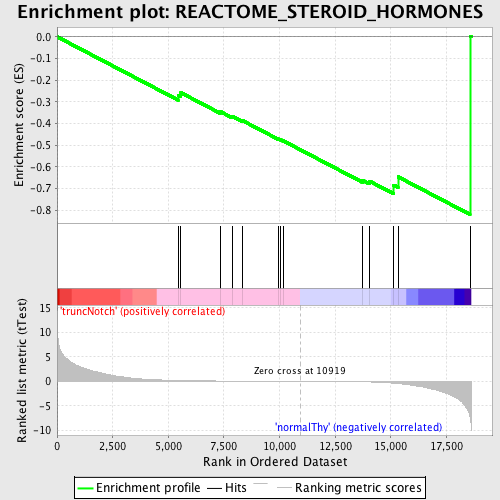
Profile of the Running ES Score & Positions of GeneSet Members on the Rank Ordered List
| Dataset | Set_03_truncNotch_versus_normalThy.phenotype_truncNotch_versus_normalThy.cls #truncNotch_versus_normalThy.phenotype_truncNotch_versus_normalThy.cls #truncNotch_versus_normalThy_repos |
| Phenotype | phenotype_truncNotch_versus_normalThy.cls#truncNotch_versus_normalThy_repos |
| Upregulated in class | normalThy |
| GeneSet | REACTOME_STEROID_HORMONES |
| Enrichment Score (ES) | -0.8204384 |
| Normalized Enrichment Score (NES) | -1.518036 |
| Nominal p-value | 0.02826087 |
| FDR q-value | 0.3746722 |
| FWER p-Value | 0.997 |
| PROBE | DESCRIPTION (from dataset) | GENE SYMBOL | GENE_TITLE | RANK IN GENE LIST | RANK METRIC SCORE | RUNNING ES | CORE ENRICHMENT | |
|---|---|---|---|---|---|---|---|---|
| 1 | CYP2R1 | 2360010 | 5439 | 0.187 | -0.2713 | No | ||
| 2 | LRP2 | 1400204 3290706 | 5562 | 0.175 | -0.2582 | No | ||
| 3 | GC | 2850181 | 7329 | 0.073 | -0.3449 | No | ||
| 4 | CYP27B1 | 5270114 5360010 | 7873 | 0.057 | -0.3676 | No | ||
| 5 | CYP17A1 | 1340408 | 8322 | 0.047 | -0.3865 | No | ||
| 6 | CYP11B2 | 5340129 | 9942 | 0.016 | -0.4717 | No | ||
| 7 | CYP19A1 | 1850435 | 10041 | 0.015 | -0.4753 | No | ||
| 8 | CUBN | 630338 | 10164 | 0.013 | -0.4804 | No | ||
| 9 | CYP24A1 | 2340338 | 13730 | -0.086 | -0.6624 | No | ||
| 10 | HSD17B3 | 360066 4760278 | 14032 | -0.111 | -0.6660 | No | ||
| 11 | CYP11A1 | 3450037 | 15130 | -0.356 | -0.6850 | Yes | ||
| 12 | STAR | 7040670 | 15327 | -0.434 | -0.6467 | Yes | ||
| 13 | HSD11B1 | 450066 5550408 | 18560 | -7.316 | 0.0030 | Yes |