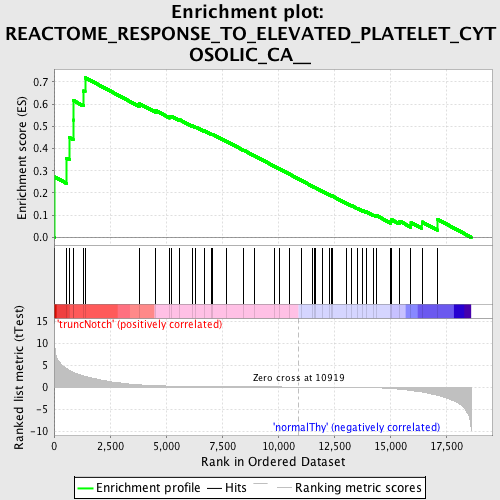
Profile of the Running ES Score & Positions of GeneSet Members on the Rank Ordered List
| Dataset | Set_03_truncNotch_versus_normalThy.phenotype_truncNotch_versus_normalThy.cls #truncNotch_versus_normalThy.phenotype_truncNotch_versus_normalThy.cls #truncNotch_versus_normalThy_repos |
| Phenotype | phenotype_truncNotch_versus_normalThy.cls#truncNotch_versus_normalThy_repos |
| Upregulated in class | truncNotch |
| GeneSet | REACTOME_RESPONSE_TO_ELEVATED_PLATELET_CYTOSOLIC_CA__ |
| Enrichment Score (ES) | 0.71979463 |
| Normalized Enrichment Score (NES) | 1.6261824 |
| Nominal p-value | 0.0016949152 |
| FDR q-value | 0.049874015 |
| FWER p-Value | 0.521 |
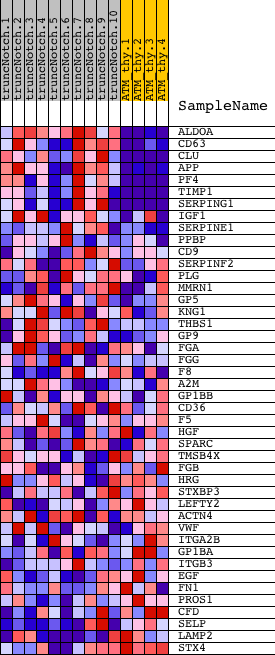
| PROBE | DESCRIPTION (from dataset) | GENE SYMBOL | GENE_TITLE | RANK IN GENE LIST | RANK METRIC SCORE | RUNNING ES | CORE ENRICHMENT | |
|---|---|---|---|---|---|---|---|---|
| 1 | ALDOA | 6290672 | 14 | 10.281 | 0.2722 | Yes | ||
| 2 | CD63 | 6660451 | 548 | 4.249 | 0.3563 | Yes | ||
| 3 | CLU | 5420075 | 682 | 3.768 | 0.4492 | Yes | ||
| 4 | APP | 2510053 | 850 | 3.332 | 0.5287 | Yes | ||
| 5 | PF4 | 6130332 | 855 | 3.318 | 0.6165 | Yes | ||
| 6 | TIMP1 | 1010326 | 1304 | 2.526 | 0.6595 | Yes | ||
| 7 | SERPING1 | 5550440 | 1381 | 2.426 | 0.7198 | Yes | ||
| 8 | IGF1 | 1990193 3130377 3290280 | 3811 | 0.487 | 0.6019 | No | ||
| 9 | SERPINE1 | 4210403 | 4534 | 0.311 | 0.5713 | No | ||
| 10 | PPBP | 5130446 | 5162 | 0.219 | 0.5434 | No | ||
| 11 | CD9 | 4730041 | 5255 | 0.208 | 0.5439 | No | ||
| 12 | SERPINF2 | 2470390 2690292 | 5617 | 0.171 | 0.5290 | No | ||
| 13 | PLG | 3360270 3840100 | 6174 | 0.126 | 0.5024 | No | ||
| 14 | MMRN1 | 7050278 | 6333 | 0.116 | 0.4970 | No | ||
| 15 | GP5 | 2510088 | 6703 | 0.098 | 0.4797 | No | ||
| 16 | KNG1 | 6400576 6770347 | 7024 | 0.084 | 0.4648 | No | ||
| 17 | THBS1 | 4560494 430288 | 7087 | 0.082 | 0.4636 | No | ||
| 18 | GP9 | 1190181 | 7683 | 0.063 | 0.4332 | No | ||
| 19 | FGA | 4210056 5220239 | 8465 | 0.043 | 0.3923 | No | ||
| 20 | FGG | 4610717 | 8932 | 0.033 | 0.3681 | No | ||
| 21 | F8 | 2190647 2340465 | 9820 | 0.018 | 0.3208 | No | ||
| 22 | A2M | 6620039 | 10071 | 0.014 | 0.3077 | No | ||
| 23 | GP1BB | 3780075 | 10491 | 0.007 | 0.2854 | No | ||
| 24 | CD36 | 5890575 | 11024 | -0.002 | 0.2568 | No | ||
| 25 | F5 | 1990619 | 11544 | -0.011 | 0.2291 | No | ||
| 26 | HGF | 3360593 | 11644 | -0.013 | 0.2241 | No | ||
| 27 | SPARC | 1690086 | 11662 | -0.013 | 0.2236 | No | ||
| 28 | TMSB4X | 6620114 | 11994 | -0.020 | 0.2063 | No | ||
| 29 | FGB | 7000010 | 12289 | -0.027 | 0.1912 | No | ||
| 30 | HRG | 2340161 | 12375 | -0.029 | 0.1874 | No | ||
| 31 | STXBP3 | 780706 | 12405 | -0.030 | 0.1866 | No | ||
| 32 | LEFTY2 | 5670364 | 13059 | -0.050 | 0.1527 | No | ||
| 33 | ACTN4 | 3840301 4590390 7050132 | 13280 | -0.059 | 0.1425 | No | ||
| 34 | VWF | 4670519 | 13535 | -0.073 | 0.1307 | No | ||
| 35 | ITGA2B | 2680538 | 13781 | -0.090 | 0.1199 | No | ||
| 36 | GP1BA | 6590372 | 13929 | -0.101 | 0.1147 | No | ||
| 37 | ITGB3 | 5270463 | 14270 | -0.139 | 0.1001 | No | ||
| 38 | EGF | 5220154 | 14409 | -0.162 | 0.0970 | No | ||
| 39 | FN1 | 1170601 2970647 6220288 6940037 | 15036 | -0.322 | 0.0718 | No | ||
| 40 | PROS1 | 5420465 | 15075 | -0.337 | 0.0787 | No | ||
| 41 | CFD | 2320736 | 15415 | -0.484 | 0.0733 | No | ||
| 42 | SELP | 6040193 | 15930 | -0.767 | 0.0660 | No | ||
| 43 | LAMP2 | 1230402 1980373 | 16422 | -1.110 | 0.0690 | No | ||
| 44 | STX4 | 6270632 | 17101 | -1.847 | 0.0816 | No |