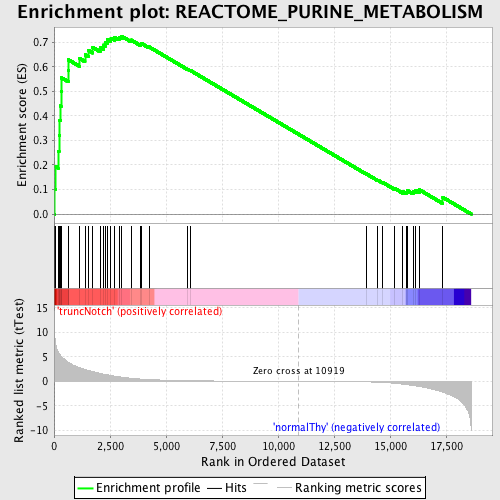
Profile of the Running ES Score & Positions of GeneSet Members on the Rank Ordered List
| Dataset | Set_03_truncNotch_versus_normalThy.phenotype_truncNotch_versus_normalThy.cls #truncNotch_versus_normalThy.phenotype_truncNotch_versus_normalThy.cls #truncNotch_versus_normalThy_repos |
| Phenotype | phenotype_truncNotch_versus_normalThy.cls#truncNotch_versus_normalThy_repos |
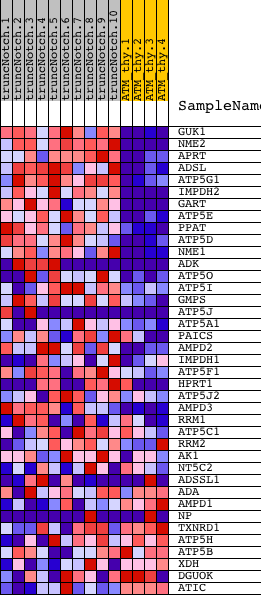
| Upregulated in class | truncNotch |
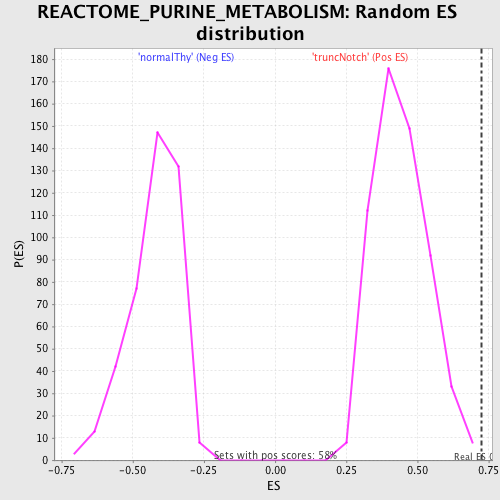
| GeneSet | REACTOME_PURINE_METABOLISM |
| Enrichment Score (ES) | 0.725129 |
| Normalized Enrichment Score (NES) | 1.6423632 |
| Nominal p-value | 0.0017301039 |
| FDR q-value | 0.044949986 |
| FWER p-Value | 0.399 |
| PROBE | DESCRIPTION (from dataset) | GENE SYMBOL | GENE_TITLE | RANK IN GENE LIST | RANK METRIC SCORE | RUNNING ES | CORE ENRICHMENT | |
|---|---|---|---|---|---|---|---|---|
| 1 | GUK1 | 5900059 | 32 | 8.897 | 0.1007 | Yes | ||
| 2 | NME2 | 2190672 | 50 | 8.197 | 0.1942 | Yes | ||
| 3 | APRT | 7000403 | 180 | 6.012 | 0.2565 | Yes | ||
| 4 | ADSL | 5570484 | 223 | 5.722 | 0.3202 | Yes | ||
| 5 | ATP5G1 | 5290019 | 253 | 5.555 | 0.3826 | Yes | ||
| 6 | IMPDH2 | 5220138 | 292 | 5.237 | 0.4408 | Yes | ||
| 7 | GART | 5910114 7000594 | 314 | 5.102 | 0.4985 | Yes | ||
| 8 | ATP5E | 4120411 | 333 | 4.999 | 0.5551 | Yes | ||
| 9 | PPAT | 1980019 | 630 | 3.927 | 0.5844 | Yes | ||
| 10 | ATP5D | 6550167 | 642 | 3.882 | 0.6285 | Yes | ||
| 11 | NME1 | 770014 | 1145 | 2.786 | 0.6336 | Yes | ||
| 12 | ADK | 380338 520180 5270524 | 1379 | 2.427 | 0.6490 | Yes | ||
| 13 | ATP5O | 7000398 | 1544 | 2.218 | 0.6657 | Yes | ||
| 14 | ATP5I | 6220047 | 1721 | 2.004 | 0.6793 | Yes | ||
| 15 | GMPS | 460670 | 2055 | 1.658 | 0.6805 | Yes | ||
| 16 | ATP5J | 4210100 6900288 | 2216 | 1.484 | 0.6890 | Yes | ||
| 17 | ATP5A1 | 1990722 | 2302 | 1.410 | 0.7006 | Yes | ||
| 18 | PAICS | 610142 | 2378 | 1.343 | 0.7121 | Yes | ||
| 19 | AMPD2 | 630093 1170070 | 2538 | 1.171 | 0.7170 | Yes | ||
| 20 | IMPDH1 | 3190735 7050546 | 2698 | 1.052 | 0.7205 | Yes | ||
| 21 | ATP5F1 | 7000725 | 2904 | 0.946 | 0.7204 | Yes | ||
| 22 | HPRT1 | 1690398 4920619 6350170 | 3005 | 0.878 | 0.7251 | Yes | ||
| 23 | ATP5J2 | 2630706 | 3432 | 0.630 | 0.7095 | No | ||
| 24 | AMPD3 | 610369 3360528 | 3853 | 0.475 | 0.6923 | No | ||
| 25 | RRM1 | 4150433 | 3904 | 0.461 | 0.6949 | No | ||
| 26 | ATP5C1 | 5910601 | 4241 | 0.371 | 0.6811 | No | ||
| 27 | RRM2 | 6350059 6940162 | 5949 | 0.140 | 0.5909 | No | ||
| 28 | AK1 | 130605 | 6066 | 0.132 | 0.5861 | No | ||
| 29 | NT5C2 | 4280735 4670528 | 13936 | -0.102 | 0.1637 | No | ||
| 30 | ADSSL1 | 4850132 7000288 | 14445 | -0.167 | 0.1383 | No | ||
| 31 | ADA | 2120403 3130075 | 14665 | -0.214 | 0.1290 | No | ||
| 32 | AMPD1 | 3520132 | 15179 | -0.377 | 0.1057 | No | ||
| 33 | NP | 2630577 3120142 5670068 6290039 | 15561 | -0.555 | 0.0916 | No | ||
| 34 | TXNRD1 | 6590446 | 15742 | -0.661 | 0.0895 | No | ||
| 35 | ATP5H | 670438 | 15772 | -0.673 | 0.0957 | No | ||
| 36 | ATP5B | 3870138 | 16029 | -0.841 | 0.0916 | No | ||
| 37 | XDH | 6840446 | 16137 | -0.919 | 0.0965 | No | ||
| 38 | DGUOK | 5050280 6290300 | 16310 | -1.010 | 0.0988 | No | ||
| 39 | ATIC | 4010593 6380463 | 17351 | -2.191 | 0.0681 | No |