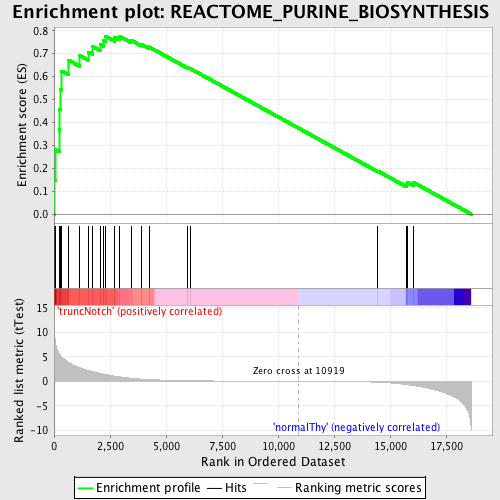
Profile of the Running ES Score & Positions of GeneSet Members on the Rank Ordered List
| Dataset | Set_03_truncNotch_versus_normalThy.phenotype_truncNotch_versus_normalThy.cls #truncNotch_versus_normalThy.phenotype_truncNotch_versus_normalThy.cls #truncNotch_versus_normalThy_repos |
| Phenotype | phenotype_truncNotch_versus_normalThy.cls#truncNotch_versus_normalThy_repos |
| Upregulated in class | truncNotch |
| GeneSet | REACTOME_PURINE_BIOSYNTHESIS |
| Enrichment Score (ES) | 0.77676094 |
| Normalized Enrichment Score (NES) | 1.6018103 |
| Nominal p-value | 0.004901961 |
| FDR q-value | 0.068037085 |
| FWER p-Value | 0.693 |
| PROBE | DESCRIPTION (from dataset) | GENE SYMBOL | GENE_TITLE | RANK IN GENE LIST | RANK METRIC SCORE | RUNNING ES | CORE ENRICHMENT | |
|---|---|---|---|---|---|---|---|---|
| 1 | GUK1 | 5900059 | 32 | 8.897 | 0.1463 | Yes | ||
| 2 | NME2 | 2190672 | 50 | 8.197 | 0.2817 | Yes | ||
| 3 | ADSL | 5570484 | 223 | 5.722 | 0.3676 | Yes | ||
| 4 | ATP5G1 | 5290019 | 253 | 5.555 | 0.4584 | Yes | ||
| 5 | IMPDH2 | 5220138 | 292 | 5.237 | 0.5435 | Yes | ||
| 6 | ATP5E | 4120411 | 333 | 4.999 | 0.6245 | Yes | ||
| 7 | ATP5D | 6550167 | 642 | 3.882 | 0.6725 | Yes | ||
| 8 | NME1 | 770014 | 1145 | 2.786 | 0.6918 | Yes | ||
| 9 | ATP5O | 7000398 | 1544 | 2.218 | 0.7073 | Yes | ||
| 10 | ATP5I | 6220047 | 1721 | 2.004 | 0.7312 | Yes | ||
| 11 | GMPS | 460670 | 2055 | 1.658 | 0.7408 | Yes | ||
| 12 | ATP5J | 4210100 6900288 | 2216 | 1.484 | 0.7569 | Yes | ||
| 13 | ATP5A1 | 1990722 | 2302 | 1.410 | 0.7758 | Yes | ||
| 14 | IMPDH1 | 3190735 7050546 | 2698 | 1.052 | 0.7721 | Yes | ||
| 15 | ATP5F1 | 7000725 | 2904 | 0.946 | 0.7768 | Yes | ||
| 16 | ATP5J2 | 2630706 | 3432 | 0.630 | 0.7589 | No | ||
| 17 | RRM1 | 4150433 | 3904 | 0.461 | 0.7412 | No | ||
| 18 | ATP5C1 | 5910601 | 4241 | 0.371 | 0.7293 | No | ||
| 19 | RRM2 | 6350059 6940162 | 5949 | 0.140 | 0.6399 | No | ||
| 20 | AK1 | 130605 | 6066 | 0.132 | 0.6358 | No | ||
| 21 | ADSSL1 | 4850132 7000288 | 14445 | -0.167 | 0.1880 | No | ||
| 22 | TXNRD1 | 6590446 | 15742 | -0.661 | 0.1293 | No | ||
| 23 | ATP5H | 670438 | 15772 | -0.673 | 0.1389 | No | ||
| 24 | ATP5B | 3870138 | 16029 | -0.841 | 0.1391 | No |

