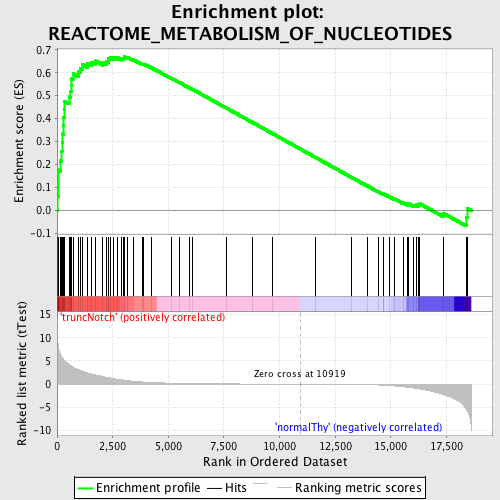
Profile of the Running ES Score & Positions of GeneSet Members on the Rank Ordered List
| Dataset | Set_03_truncNotch_versus_normalThy.phenotype_truncNotch_versus_normalThy.cls #truncNotch_versus_normalThy.phenotype_truncNotch_versus_normalThy.cls #truncNotch_versus_normalThy_repos |
| Phenotype | phenotype_truncNotch_versus_normalThy.cls#truncNotch_versus_normalThy_repos |
| Upregulated in class | truncNotch |
| GeneSet | REACTOME_METABOLISM_OF_NUCLEOTIDES |
| Enrichment Score (ES) | 0.6691421 |
| Normalized Enrichment Score (NES) | 1.598625 |
| Nominal p-value | 0.0016583748 |
| FDR q-value | 0.06420746 |
| FWER p-Value | 0.72 |
| PROBE | DESCRIPTION (from dataset) | GENE SYMBOL | GENE_TITLE | RANK IN GENE LIST | RANK METRIC SCORE | RUNNING ES | CORE ENRICHMENT | |
|---|---|---|---|---|---|---|---|---|
| 1 | GUK1 | 5900059 | 32 | 8.897 | 0.0614 | Yes | ||
| 2 | NME2 | 2190672 | 50 | 8.197 | 0.1186 | Yes | ||
| 3 | CAD | 2340717 | 51 | 8.137 | 0.1764 | Yes | ||
| 4 | DCTD | 940162 | 154 | 6.329 | 0.2158 | Yes | ||
| 5 | APRT | 7000403 | 180 | 6.012 | 0.2571 | Yes | ||
| 6 | ADSL | 5570484 | 223 | 5.722 | 0.2954 | Yes | ||
| 7 | ATP5G1 | 5290019 | 253 | 5.555 | 0.3332 | Yes | ||
| 8 | DHODH | 3170072 | 278 | 5.332 | 0.3698 | Yes | ||
| 9 | IMPDH2 | 5220138 | 292 | 5.237 | 0.4062 | Yes | ||
| 10 | GART | 5910114 7000594 | 314 | 5.102 | 0.4413 | Yes | ||
| 11 | ATP5E | 4120411 | 333 | 4.999 | 0.4758 | Yes | ||
| 12 | CTPS | 70451 1740132 | 540 | 4.258 | 0.4949 | Yes | ||
| 13 | UMPS | 2340541 4730438 | 621 | 3.938 | 0.5185 | Yes | ||
| 14 | PPAT | 1980019 | 630 | 3.927 | 0.5460 | Yes | ||
| 15 | ATP5D | 6550167 | 642 | 3.882 | 0.5729 | Yes | ||
| 16 | NME4 | 3140736 5900446 | 717 | 3.684 | 0.5951 | Yes | ||
| 17 | GSR | 3520079 | 962 | 3.109 | 0.6040 | Yes | ||
| 18 | TK1 | 540014 540494 6760152 | 1047 | 2.955 | 0.6204 | Yes | ||
| 19 | NME1 | 770014 | 1145 | 2.786 | 0.6349 | Yes | ||
| 20 | ADK | 380338 520180 5270524 | 1379 | 2.427 | 0.6396 | Yes | ||
| 21 | ATP5O | 7000398 | 1544 | 2.218 | 0.6465 | Yes | ||
| 22 | ATP5I | 6220047 | 1721 | 2.004 | 0.6512 | Yes | ||
| 23 | GMPS | 460670 | 2055 | 1.658 | 0.6450 | Yes | ||
| 24 | ATP5J | 4210100 6900288 | 2216 | 1.484 | 0.6469 | Yes | ||
| 25 | ATP5A1 | 1990722 | 2302 | 1.410 | 0.6524 | Yes | ||
| 26 | DTYMK | 2340377 | 2321 | 1.391 | 0.6613 | Yes | ||
| 27 | PAICS | 610142 | 2378 | 1.343 | 0.6678 | Yes | ||
| 28 | AMPD2 | 630093 1170070 | 2538 | 1.171 | 0.6675 | Yes | ||
| 29 | IMPDH1 | 3190735 7050546 | 2698 | 1.052 | 0.6664 | Yes | ||
| 30 | ATP5F1 | 7000725 | 2904 | 0.946 | 0.6621 | Yes | ||
| 31 | HPRT1 | 1690398 4920619 6350170 | 3005 | 0.878 | 0.6629 | Yes | ||
| 32 | AK2 | 4590458 4760195 6110097 | 3006 | 0.878 | 0.6691 | Yes | ||
| 33 | SLC29A2 | 3290497 | 3143 | 0.788 | 0.6674 | No | ||
| 34 | ATP5J2 | 2630706 | 3432 | 0.630 | 0.6564 | No | ||
| 35 | AMPD3 | 610369 3360528 | 3853 | 0.475 | 0.6371 | No | ||
| 36 | RRM1 | 4150433 | 3904 | 0.461 | 0.6377 | No | ||
| 37 | ATP5C1 | 5910601 | 4241 | 0.371 | 0.6222 | No | ||
| 38 | RRM2B | 1690025 1690465 4010400 | 5133 | 0.222 | 0.5757 | No | ||
| 39 | SLC28A1 | 5960411 | 5488 | 0.182 | 0.5580 | No | ||
| 40 | RRM2 | 6350059 6940162 | 5949 | 0.140 | 0.5342 | No | ||
| 41 | AK1 | 130605 | 6066 | 0.132 | 0.5288 | No | ||
| 42 | CDA | 1980605 | 7631 | 0.064 | 0.4450 | No | ||
| 43 | DPYS | 3130670 | 8785 | 0.037 | 0.3831 | No | ||
| 44 | DPYD | 6110095 | 9686 | 0.021 | 0.3348 | No | ||
| 45 | NT5E | 2030603 1400731 | 11612 | -0.012 | 0.2311 | No | ||
| 46 | UPP1 | 3850358 3940100 | 13251 | -0.058 | 0.1432 | No | ||
| 47 | NT5C2 | 4280735 4670528 | 13936 | -0.102 | 0.1071 | No | ||
| 48 | ADSSL1 | 4850132 7000288 | 14445 | -0.167 | 0.0809 | No | ||
| 49 | ADA | 2120403 3130075 | 14665 | -0.214 | 0.0706 | No | ||
| 50 | TYMS | 940450 1940068 3710008 5570546 | 14671 | -0.215 | 0.0719 | No | ||
| 51 | SLC28A2 | 2970242 | 14948 | -0.297 | 0.0591 | No | ||
| 52 | AMPD1 | 3520132 | 15179 | -0.377 | 0.0494 | No | ||
| 53 | NP | 2630577 3120142 5670068 6290039 | 15561 | -0.555 | 0.0328 | No | ||
| 54 | TXNRD1 | 6590446 | 15742 | -0.661 | 0.0278 | No | ||
| 55 | ATP5H | 670438 | 15772 | -0.673 | 0.0310 | No | ||
| 56 | ATP5B | 3870138 | 16029 | -0.841 | 0.0232 | No | ||
| 57 | XDH | 6840446 | 16137 | -0.919 | 0.0239 | No | ||
| 58 | TK2 | 70725 | 16251 | -0.989 | 0.0248 | No | ||
| 59 | DGUOK | 5050280 6290300 | 16310 | -1.010 | 0.0289 | No | ||
| 60 | ATIC | 4010593 6380463 | 17351 | -2.191 | -0.0116 | No | ||
| 61 | NME3 | 1660440 | 18392 | -5.365 | -0.0296 | No | ||
| 62 | DCK | 6900411 | 18452 | -5.866 | 0.0088 | No |

